QUESTION IMAGE
Question
otting and interpreting distance - time graphs
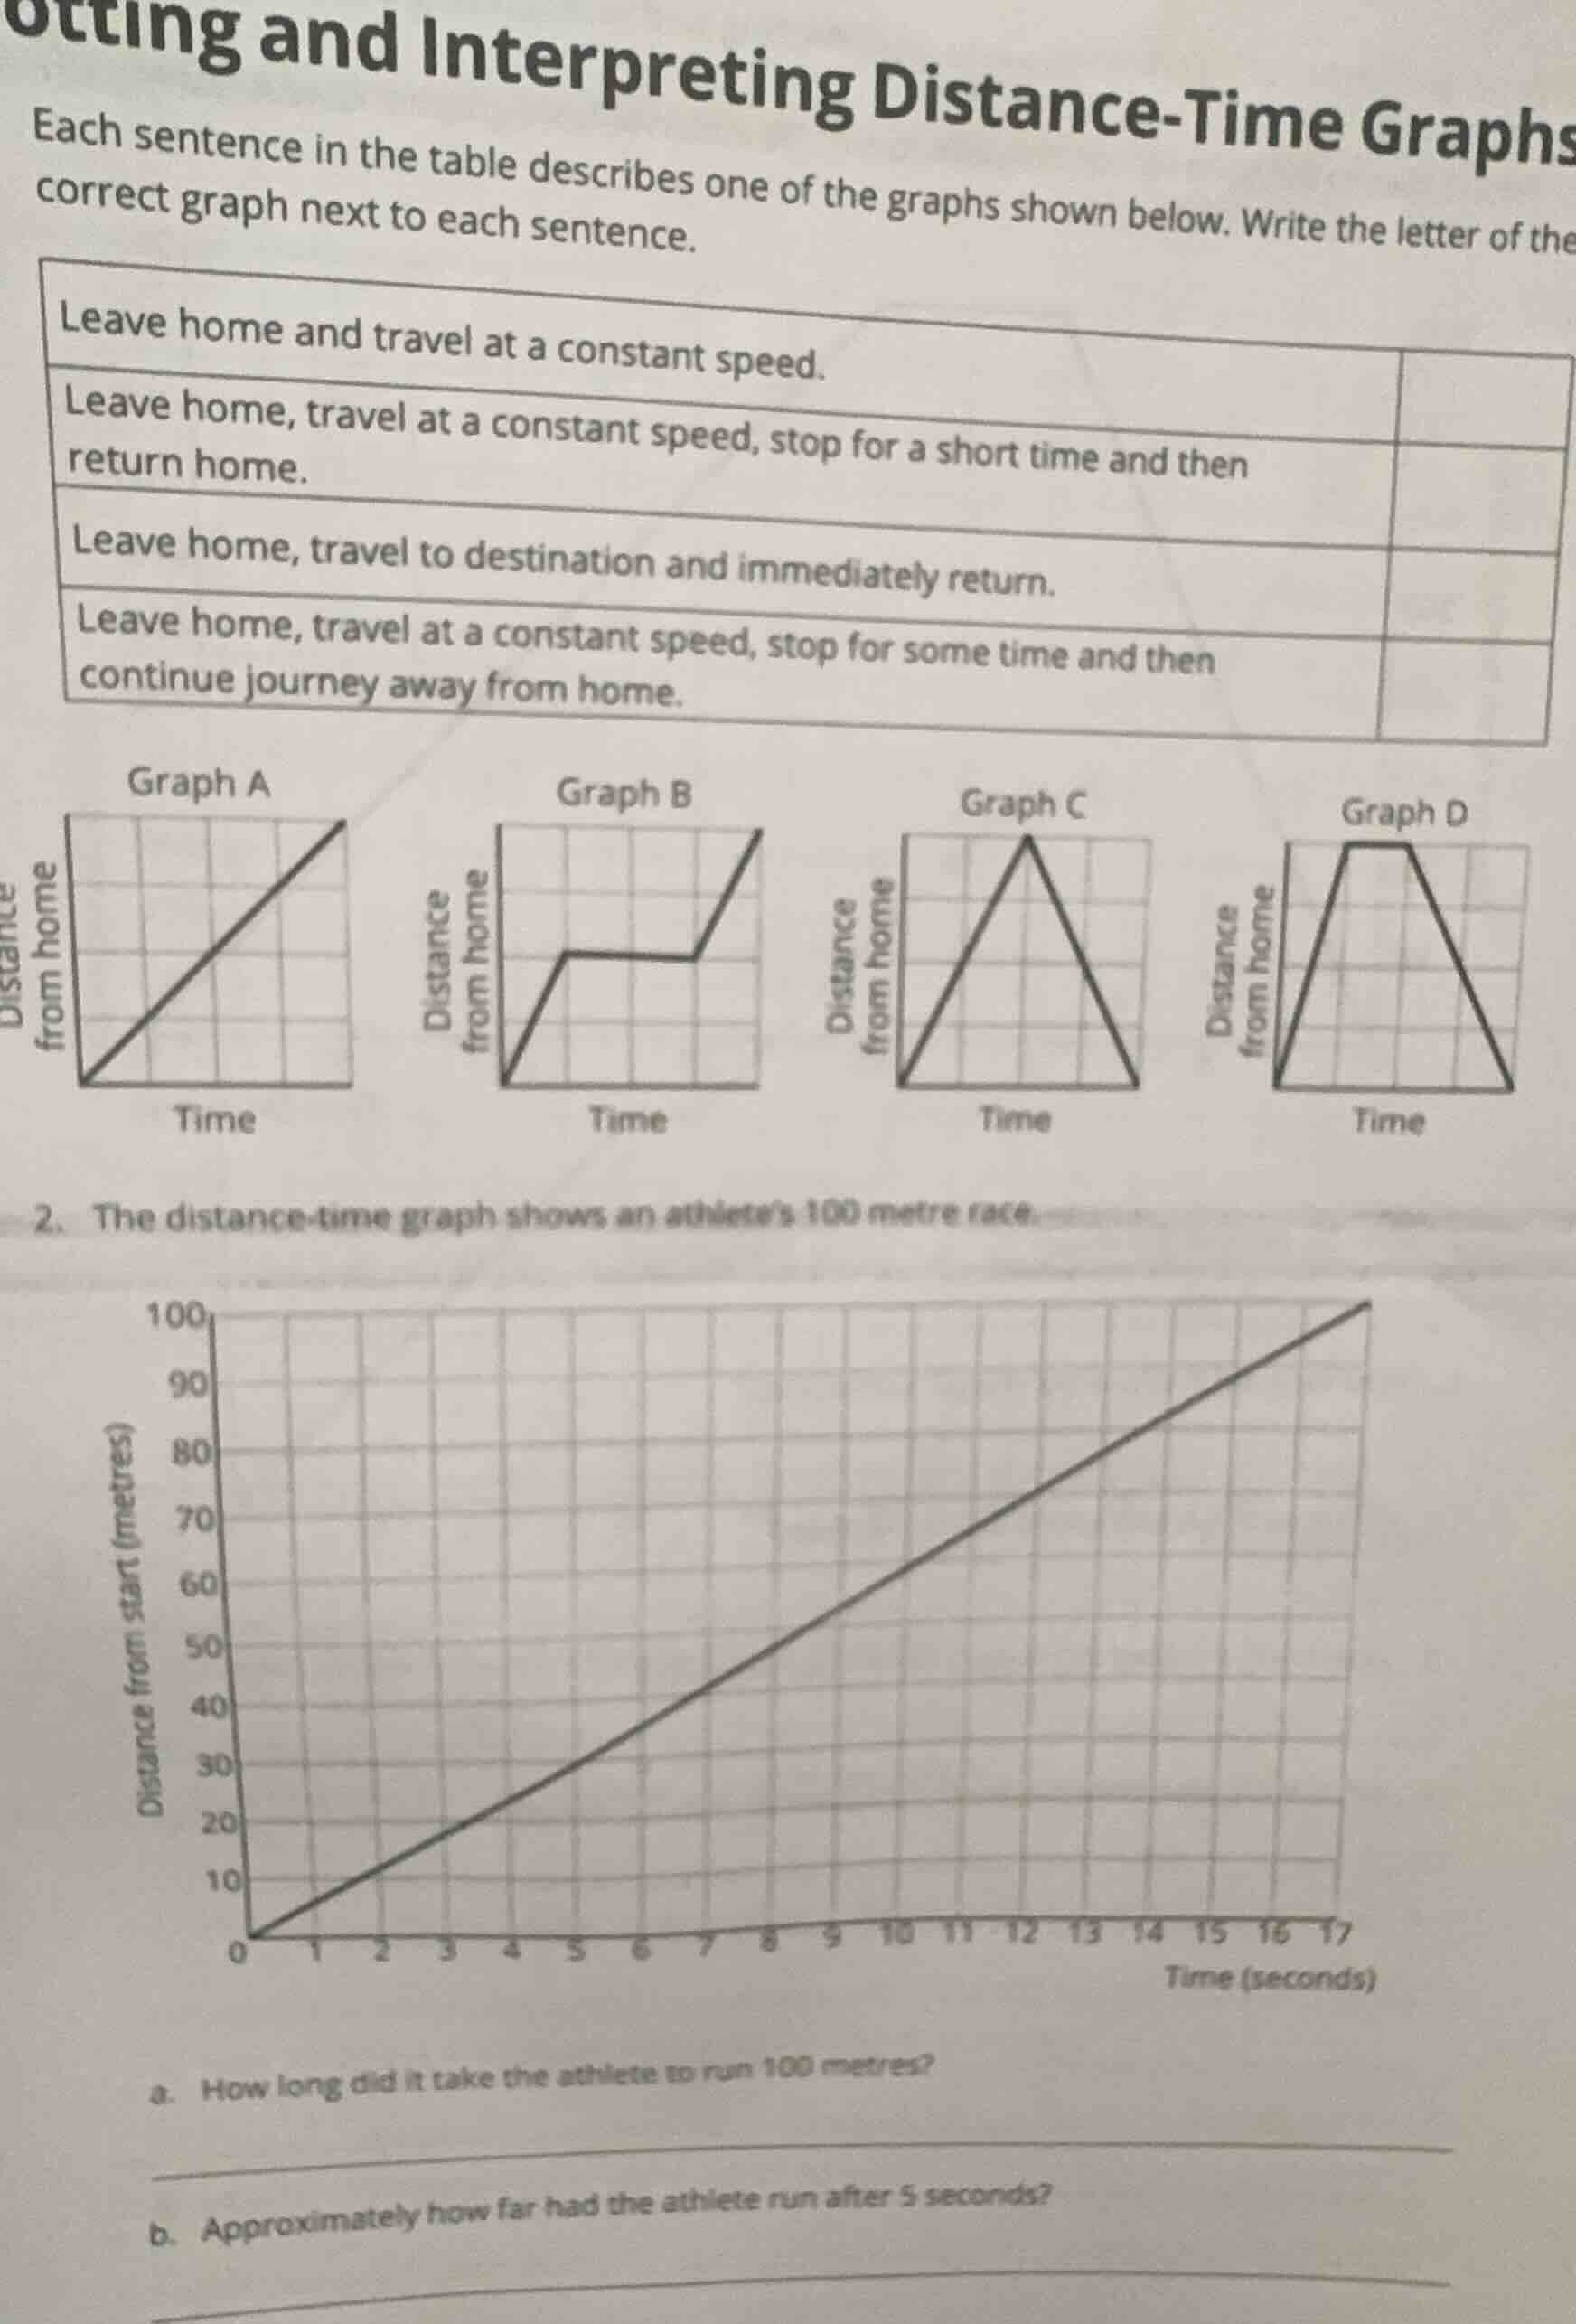
each sentence in the table describes one of the graphs shown below. write the letter of the correct graph next to each sentence.
| leave home and travel at a constant speed. | |
|---|---|
| leave home, travel to destination and immediately return. | |
| leave home, travel at a constant speed, stop for some time and then continue journey away from home. |
graph a
distance from home
time
graph b
distance from home
time
graph c
distance from home
time
graph d
distance from home
time
- the distance - time graph shows an athletes 100 metre race.
distance from start (metres)
0
10
20
30
40
50
60
70
80
90
100
0
1
2
3
4
5
6
7
8
9
10
11
12
13
14
15
16
17
time (seconds)
a. how long did it take the athlete to run 100 metres?
b. approximately how far had the athlete run after 5 seconds?
Response
Part 1: Matching Sentences to Graphs
1. "Leave home and travel at a constant speed."
- Explanation: A constant speed means the distance - time graph is a straight line with a positive slope (distance from home increases steadily with time). Graph A is a straight line starting from the origin (home) and going up, so this matches Graph A.
2. "Leave home, travel at a constant speed, stop for a short time and then return home."
- Explanation: First, there is an increase in distance (constant speed), then a flat line (stopped), then a decrease back to 0 (return home). Graph D has an increase, a flat part, and then a decrease to 0, so this matches Graph D.
3. "Leave home, travel to destination and immediately return."
- Explanation: The distance from home increases to a peak and then immediately decreases back to 0 (no stop). Graph C has a triangular shape with an increase and then a decrease, so this matches Graph C.
4. "Leave home, travel at a constant speed, stop for some time and then continue journey away from home."
- Explanation: There is an increase in distance (constant speed), a flat line (stop), and then another increase (continue away from home). Graph B has an increase, a flat part, and then another increase, so this matches Graph B.
Part 2: Analyzing the Athlete's Race Graph
a. How long did it take the athlete to run 100 metres?
- Step 1: Look at the graph. The y - axis is distance from start (in metres) and the x - axis is time (in seconds). We need to find the x - value when the y - value is 100.
- Step 2: From the graph, when the distance is 100 metres, the time on the x - axis is 17 seconds (by looking at the point where the line reaches y = 100, the corresponding x is 17).
b. Approximately how far had the athlete run after 5 seconds?
- Step 1: Find the point on the x - axis where x = 5 seconds.
- Step 2: Move up to the line of the graph and then left to the y - axis. From the graph, at x = 5 seconds, the y - value (distance) is approximately 30 metres (by estimating the position on the grid, at x = 5, the distance is around 30 metres).
Final Answers
Part 1:
- "Leave home and travel at a constant speed." : A
- "Leave home, travel at a constant speed, stop for a short time and then return home." : D
- "Leave home, travel to destination and immediately return." : C
- "Leave home, travel at a constant speed, stop for some time and then continue journey away from home." : B
Part 2:
a. 17 seconds
b. Approximately 30 metres

Snap & solve any problem in the app
Get step-by-step solutions on Sovi AI
Photo-based solutions with guided steps
Explore more problems and detailed explanations
Part 1: Matching Sentences to Graphs
1. "Leave home and travel at a constant speed."
- Explanation: A constant speed means the distance - time graph is a straight line with a positive slope (distance from home increases steadily with time). Graph A is a straight line starting from the origin (home) and going up, so this matches Graph A.
2. "Leave home, travel at a constant speed, stop for a short time and then return home."
- Explanation: First, there is an increase in distance (constant speed), then a flat line (stopped), then a decrease back to 0 (return home). Graph D has an increase, a flat part, and then a decrease to 0, so this matches Graph D.
3. "Leave home, travel to destination and immediately return."
- Explanation: The distance from home increases to a peak and then immediately decreases back to 0 (no stop). Graph C has a triangular shape with an increase and then a decrease, so this matches Graph C.
4. "Leave home, travel at a constant speed, stop for some time and then continue journey away from home."
- Explanation: There is an increase in distance (constant speed), a flat line (stop), and then another increase (continue away from home). Graph B has an increase, a flat part, and then another increase, so this matches Graph B.
Part 2: Analyzing the Athlete's Race Graph
a. How long did it take the athlete to run 100 metres?
- Step 1: Look at the graph. The y - axis is distance from start (in metres) and the x - axis is time (in seconds). We need to find the x - value when the y - value is 100.
- Step 2: From the graph, when the distance is 100 metres, the time on the x - axis is 17 seconds (by looking at the point where the line reaches y = 100, the corresponding x is 17).
b. Approximately how far had the athlete run after 5 seconds?
- Step 1: Find the point on the x - axis where x = 5 seconds.
- Step 2: Move up to the line of the graph and then left to the y - axis. From the graph, at x = 5 seconds, the y - value (distance) is approximately 30 metres (by estimating the position on the grid, at x = 5, the distance is around 30 metres).
Final Answers
Part 1:
- "Leave home and travel at a constant speed." : A
- "Leave home, travel at a constant speed, stop for a short time and then return home." : D
- "Leave home, travel to destination and immediately return." : C
- "Leave home, travel at a constant speed, stop for some time and then continue journey away from home." : B
Part 2:
a. 17 seconds
b. Approximately 30 metres