QUESTION IMAGE
Question
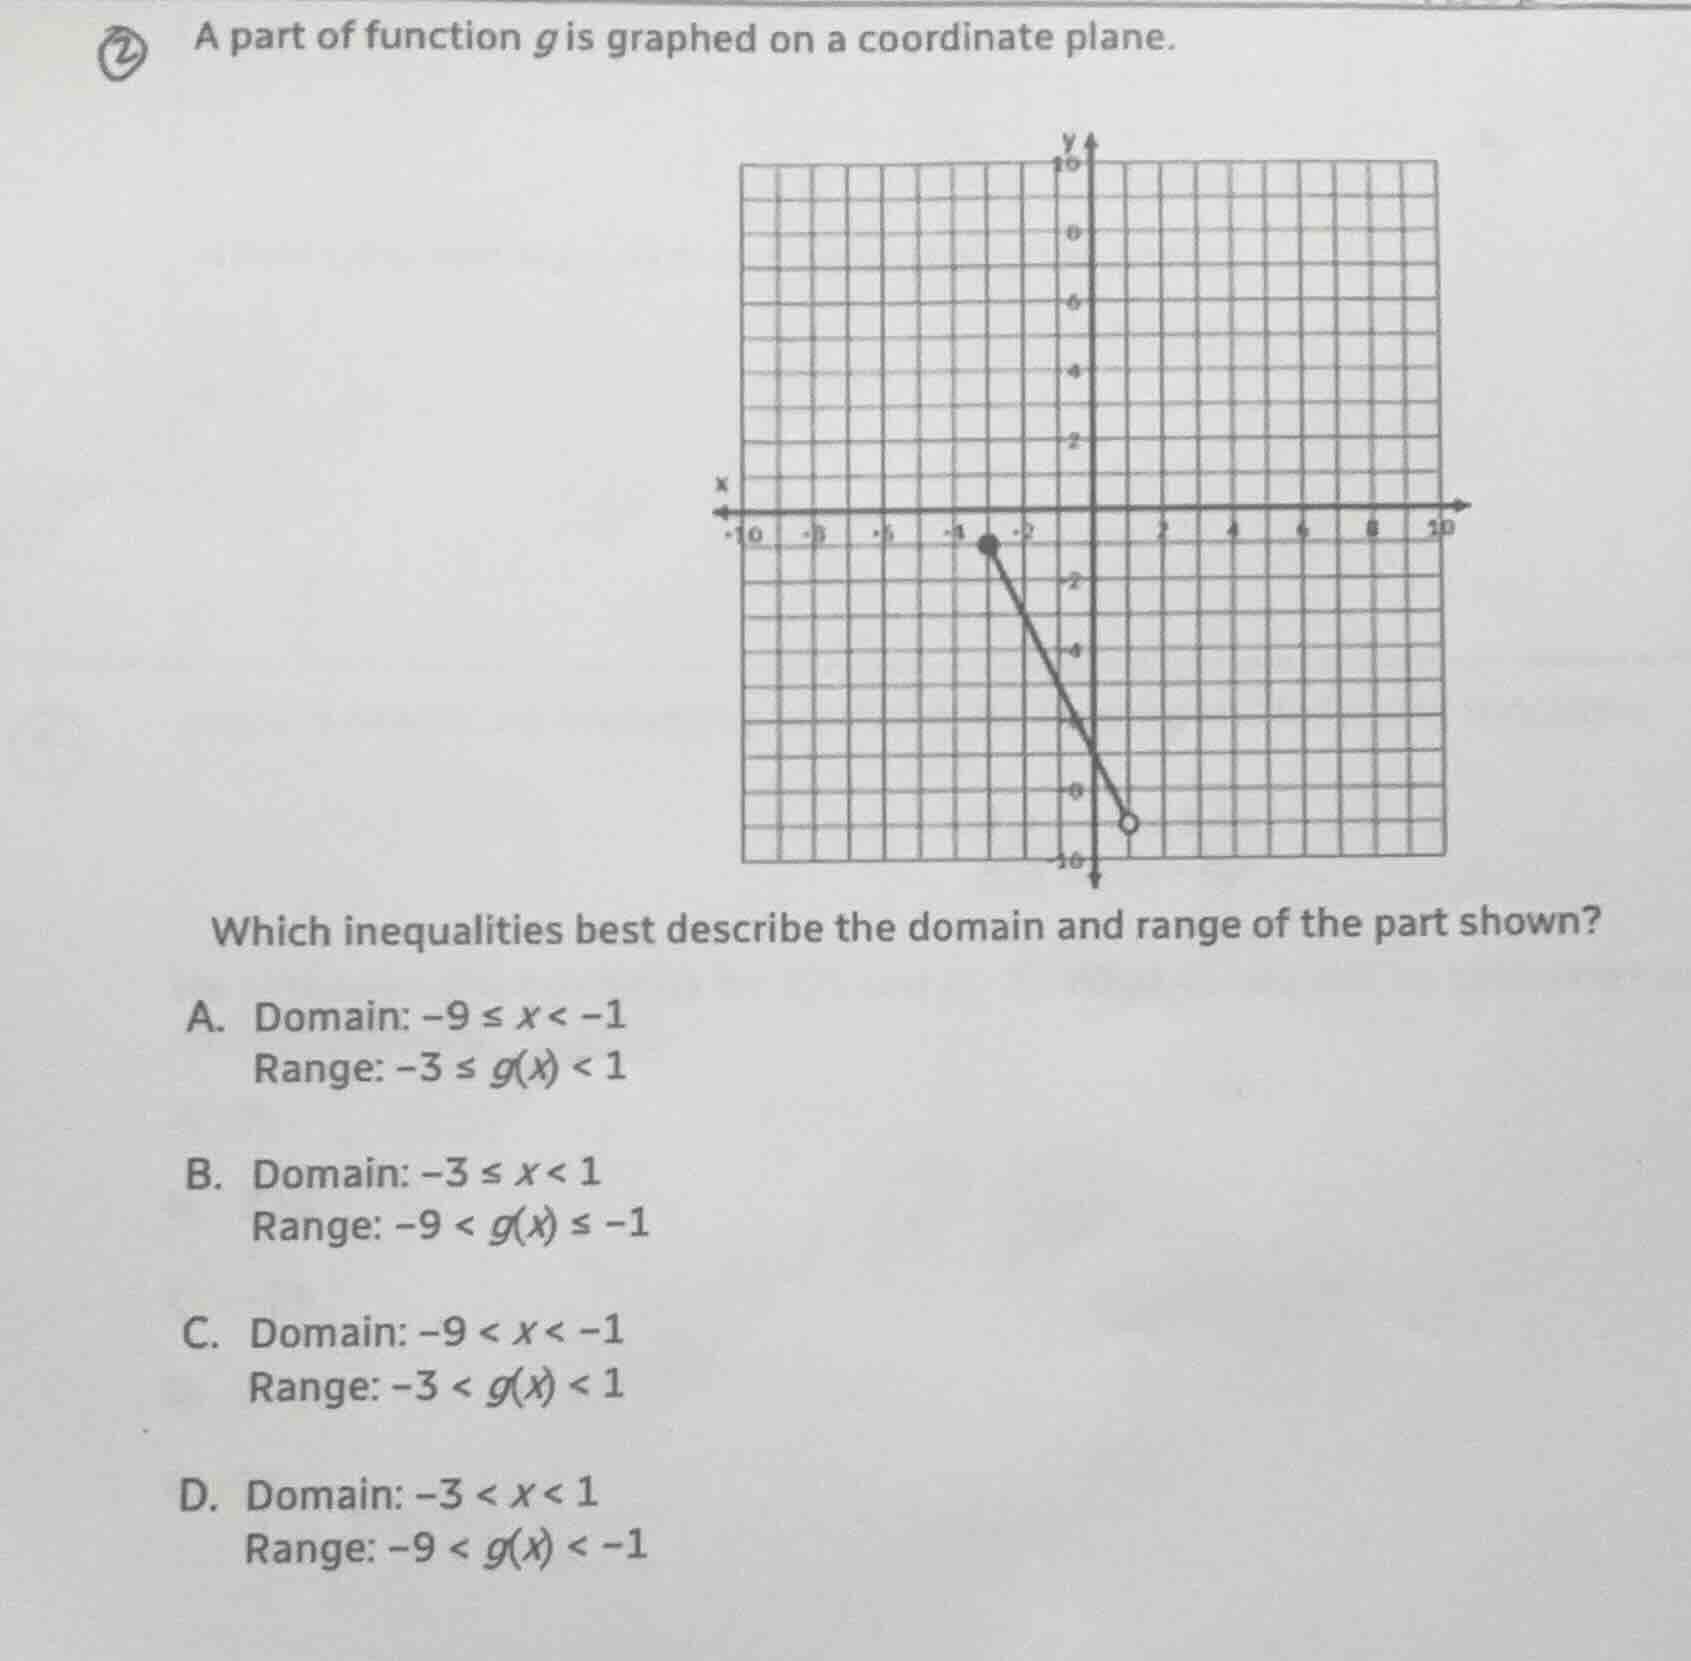
a part of function g is graphed on a coordinate plane.
which inequalities best describe the domain and range of the part shown?
a. domain: $-9 \leq x < -1$
range: $-3 \leq g(x) < 1$
b. domain: $-3 \leq x < 1$
range: $-9 < g(x) \leq -1$
c. domain: $-9 < x < -1$
range: $-3 < g(x) < 1$
d. domain: $-3 < x < 1$
range: $-9 < g(x) < -1$
Step1: Identify domain (x-values)
The graph starts at a closed dot at $x=-3$ (included) and ends at an open dot at $x=1$ (not included). So domain: $-3 \leq x < 1$.
Step2: Identify range (y-values)
The graph's highest point is a closed dot at $y=-1$ (included) and lowest is an open dot at $y=-9$ (not included). So range: $-9 < g(x) \leq -1$.

Snap & solve any problem in the app
Get step-by-step solutions on Sovi AI
Photo-based solutions with guided steps
Explore more problems and detailed explanations
B. Domain: $-3 \leq x < 1$
Range: $-9 < g(x) \leq -1$