QUESTION IMAGE
Question
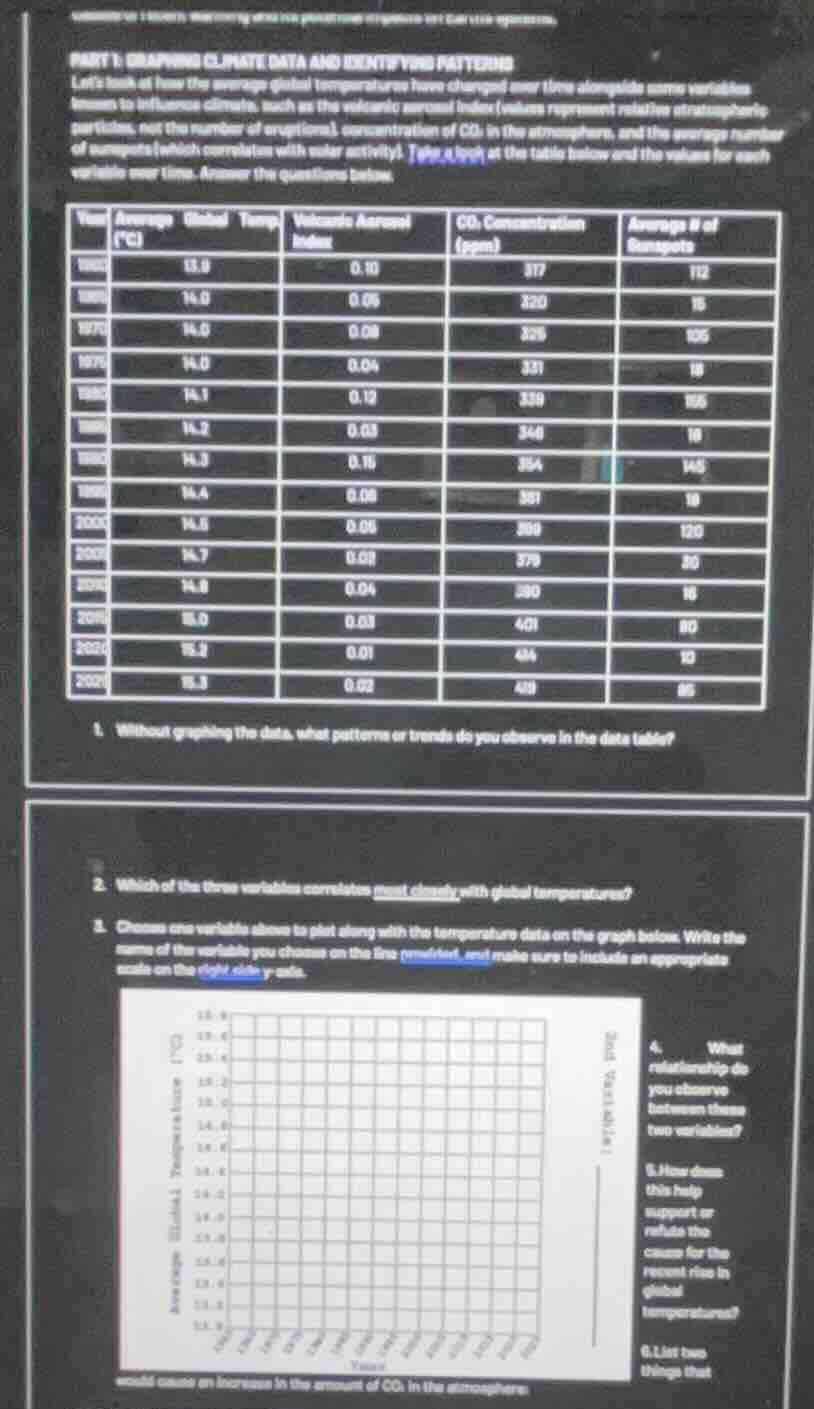
part 1: graphing climate data and identifying patterns
lets look at how the average global temperatures have changed over time alongside some variables known to influence climate, such as the volcanic aerosol index (values represent relative atmospheric particles, not the number of eruptions), concentration of co₂ in the atmosphere, and the average number of sunspots (which correlates with solar activity). take a look at the table below and the values for each variable over time. answer the questions below.
table with columns: year, average global temp (°c), volcanic aerosol index, co₂ concentration (ppm), average # of sunspots, with various year rows and corresponding data
- without graphing the data, what patterns or trends do you observe in the data table?
- which of the three variables correlates most closely with global temperature?
- choose one variable above to plot along with the temperature data on the graph below. write the name of the variable you choose on the line provided and make sure to include an appropriate scale on the right - hand y - axis.
graph with axes, year on x - axis, temperature (°c) on left y - axis, and space for right y - axis scale
- what relationship do you observe between these two variables?
- how does this help support or refute the cause for the recent rise in global temperatures?
- list two things that would cause an increase in the amount of co₂ in the atmosphere
- For the first question: Observe the direction of change for each column over the years. Average global temperature and CO₂ concentration show a steady upward trend, while volcanic aerosol index and average number of sunspots fluctuate with no clear upward/downward long-term trend.
- For the second question: Compare the trend alignment. CO₂ concentration increases consistently as global temperature rises, matching the temperature trend far more closely than the fluctuating volcanic and sunspot variables.
- For the fourth question (when pairing CO₂ and temperature): As CO₂ concentration increases, average global temperature also increases, showing a positive direct relationship.
- For the fifth question: The consistent positive correlation supports the idea that rising CO₂ is a contributing cause of global temperature rise, as the trend matches the expected effect of greenhouse gas accumulation.
- For the sixth question: Common sources of increased atmospheric CO₂ include fossil fuel combustion (for energy, transportation) and deforestation (reducing carbon absorption).

Snap & solve any problem in the app
Get step-by-step solutions on Sovi AI
Photo-based solutions with guided steps
Explore more problems and detailed explanations
- Average global temperature and CO₂ concentration show a clear upward increasing trend over time. Volcanic aerosol index and average number of sunspots fluctuate with no consistent long-term upward or downward trend.
- CO₂ Concentration correlates most closely with global temperatures.
- Example choice: CO₂ Concentration (right side y-axis would be labeled "CO₂ Concentration (ppm)" with a scale from 310 to 420)
- There is a positive direct relationship: as CO₂ concentration increases, average global temperature increases.
- This consistent positive trend supports the idea that rising atmospheric CO₂ is a contributing cause of the recent rise in global temperatures.
- 1. Burning of fossil fuels (coal, oil, gas) for electricity, heating, and transportation
- Deforestation, which reduces the number of trees that absorb CO₂ from the atmosphere