QUESTION IMAGE
Question
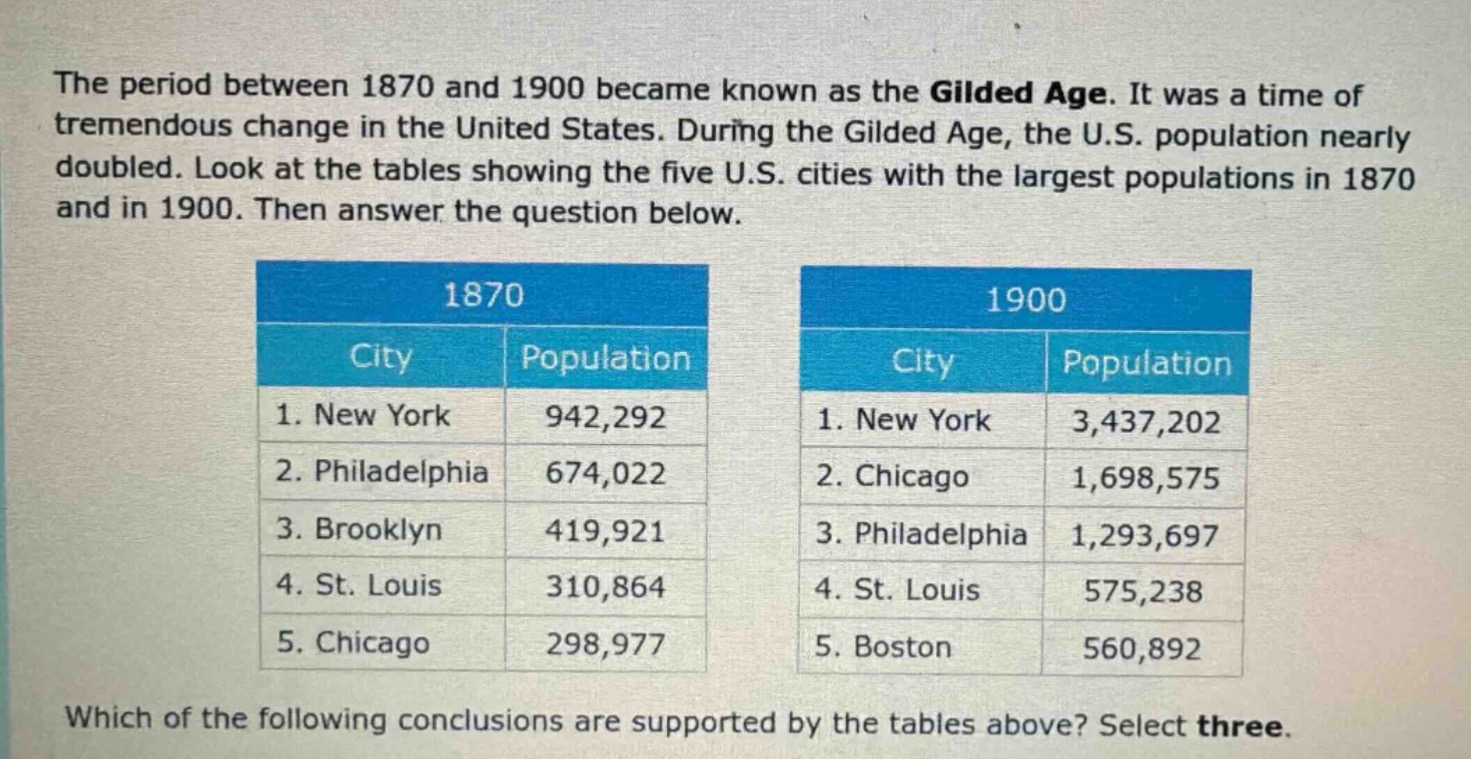
the period between 1870 and 1900 became known as the gilded age. it was a time of tremendous change in the united states. during the gilded age, the u.s. population nearly doubled. look at the tables showing the five u.s. cities with the largest populations in 1870 and in 1900. then answer the question below.
1870
| city | population |
|---|---|
| 2. philadelphia | 674,022 |
| 3. brooklyn | 419,921 |
| 4. st. louis | 310,864 |
| 5. chicago | 298,977 |
1900
| city | population |
|---|---|
| 2. chicago | 1,698,575 |
| 3. philadelphia | 1,293,697 |
| 4. st. louis | 575,238 |
| 5. boston | 560,892 |
which of the following conclusions are supported by the tables above? select three.
Since the options for the question are not provided, we can analyze the tables to identify possible valid conclusions:
Step 1: Analyze Population Changes for Each City
- New York: 1870: 942,292; 1900: 3,437,202 → Significant growth.
- Philadelphia: 1870: 674,022; 1900: 1,293,697 → Growth.
- Brooklyn: 1870: 419,921; 1900: Not in top 5 → Likely merged or outpaced by others.
- St. Louis: 1870: 310,864; 1900: 575,238 → Growth.
- Chicago: 1870: 298,977; 1900: 1,698,575 → Dramatic growth (moved from 5th to 2nd).
- Boston: 1870: Not in top 5; 1900: 5th → New entry in top 5.
Possible Valid Conclusions (Examples)
- Chicago’s population grew significantly between 1870 and 1900. (Supports: 298,977 → 1,698,575)
- New York remained the most populous U.S. city between 1870 and 1900. (Supports: 1st in both years)
- Boston entered the top five most populous U.S. cities by 1900. (Supports: Not in 1870 top 5, 5th in 1900)
To answer, select three conclusions that align with these observations. If options are provided, match them to these or similar analyses of population trends/top - 5 changes.
Since the original question’s options are missing, here’s how to evaluate:
- Check if an option matches a city’s population change (e.g., growth, rank shift, new entry in top 5).
- Verify with the numerical data from the tables.
If you provide the options, we can identify the three correct ones by comparing them to the table - derived trends.

Snap & solve any problem in the app
Get step-by-step solutions on Sovi AI
Photo-based solutions with guided steps
Explore more problems and detailed explanations
Since the options for the question are not provided, we can analyze the tables to identify possible valid conclusions:
Step 1: Analyze Population Changes for Each City
- New York: 1870: 942,292; 1900: 3,437,202 → Significant growth.
- Philadelphia: 1870: 674,022; 1900: 1,293,697 → Growth.
- Brooklyn: 1870: 419,921; 1900: Not in top 5 → Likely merged or outpaced by others.
- St. Louis: 1870: 310,864; 1900: 575,238 → Growth.
- Chicago: 1870: 298,977; 1900: 1,698,575 → Dramatic growth (moved from 5th to 2nd).
- Boston: 1870: Not in top 5; 1900: 5th → New entry in top 5.
Possible Valid Conclusions (Examples)
- Chicago’s population grew significantly between 1870 and 1900. (Supports: 298,977 → 1,698,575)
- New York remained the most populous U.S. city between 1870 and 1900. (Supports: 1st in both years)
- Boston entered the top five most populous U.S. cities by 1900. (Supports: Not in 1870 top 5, 5th in 1900)
To answer, select three conclusions that align with these observations. If options are provided, match them to these or similar analyses of population trends/top - 5 changes.
Since the original question’s options are missing, here’s how to evaluate:
- Check if an option matches a city’s population change (e.g., growth, rank shift, new entry in top 5).
- Verify with the numerical data from the tables.
If you provide the options, we can identify the three correct ones by comparing them to the table - derived trends.