QUESTION IMAGE
Question
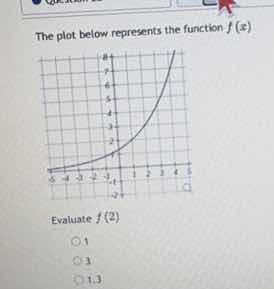
the plot below represents the function $f(x)$
evaluate $f(2)$
○ 1
○ 3
○ 1.3
Step1: Locate x=2 on the axis
Find the position $x=2$ on the horizontal axis of the graph.
Step2: Find corresponding y-value
Move vertically from $x=2$ to the curve, then horizontally to the vertical axis. The value at this point is 3.

Snap & solve any problem in the app
Get step-by-step solutions on Sovi AI
Photo-based solutions with guided steps
Explore more problems and detailed explanations
3