QUESTION IMAGE
Question
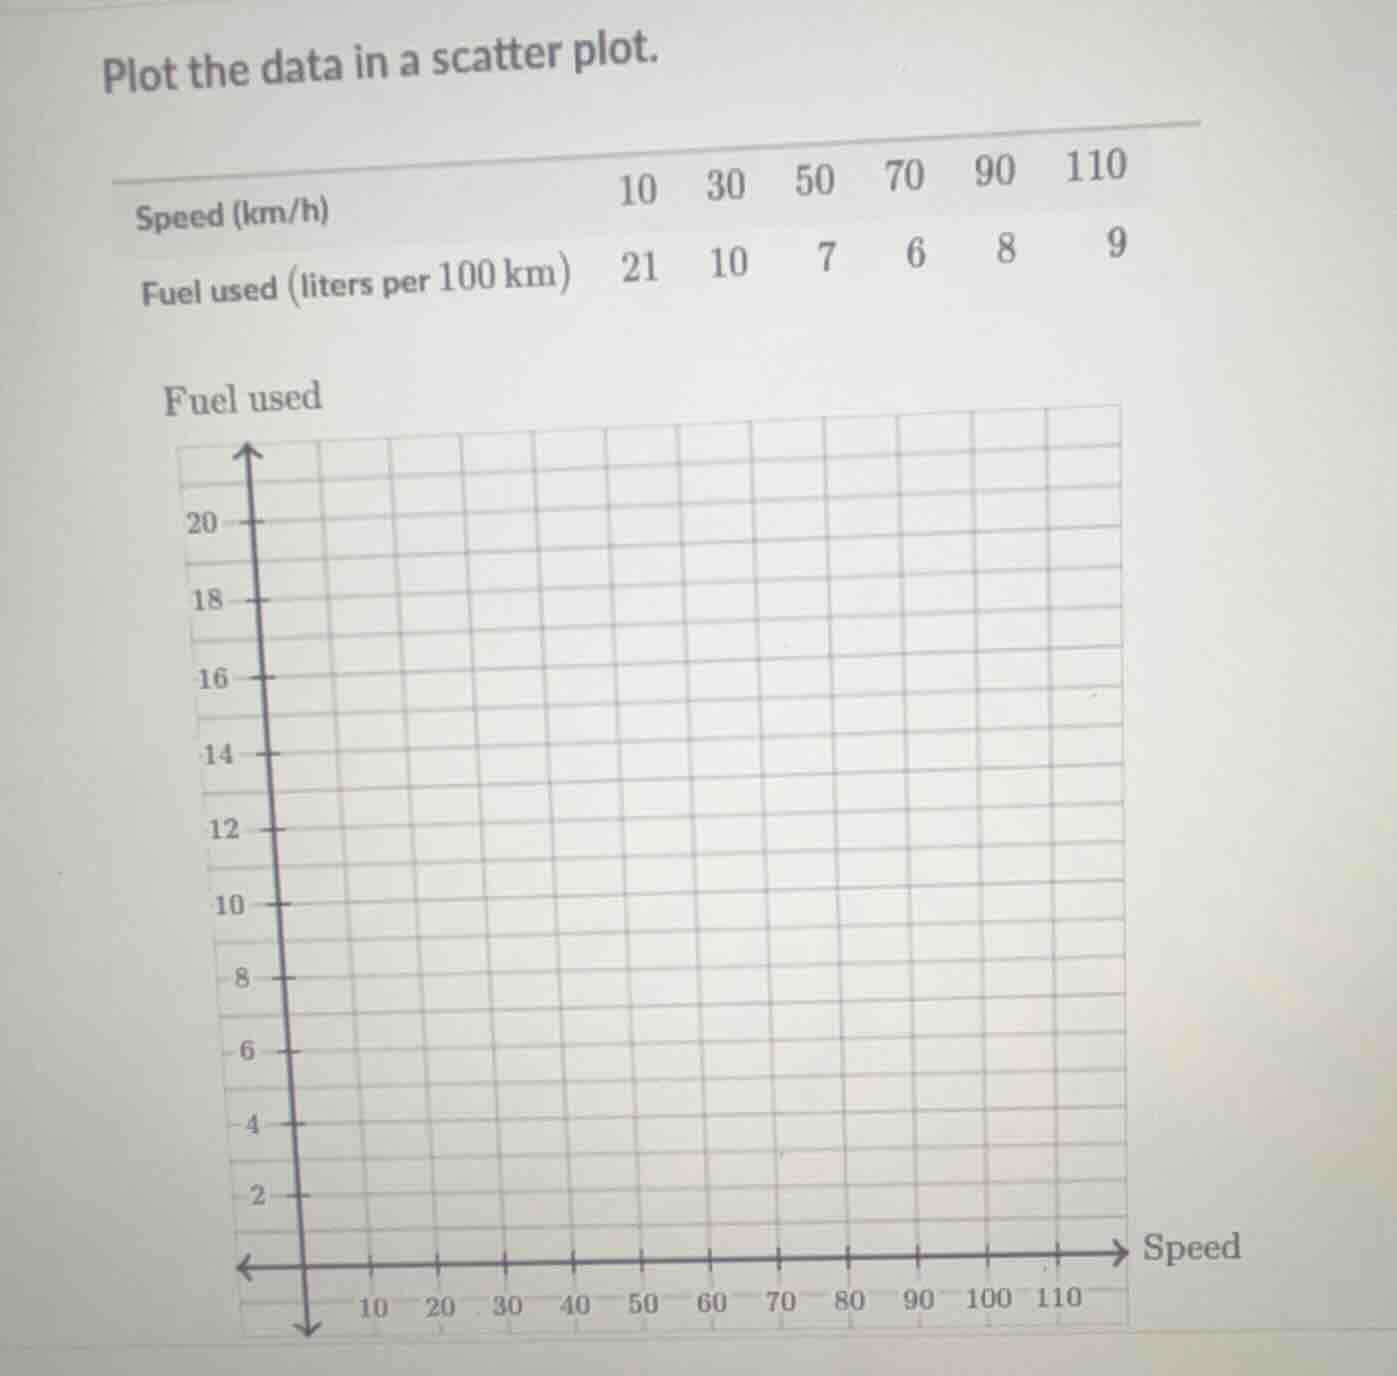
plot the data in a scatter plot.
speed (km/h) 10 30 50 70 90 110
fuel used (liters per 100 km) 21 10 7 6 8 9
fuel used
scatter plot grid with fuel used on y - axis (2,4,6,8,10,12,14,16,18,20 marked) and speed on x - axis (10,20,30,40,50,60,70,80,90,100,110 marked)
Step1: Identify data points
The paired data points are: $(10, 21)$, $(30, 10)$, $(50, 7)$, $(70, 6)$, $(90, 8)$, $(110, 9)$
Step2: Plot each data point
For each $(x,y)$ pair, locate the speed (x-value) on the horizontal axis, fuel use (y-value) on the vertical axis, and mark the intersection with a dot.
- $(10, 21)$: 10 on x-axis, 21 on y-axis
- $(30, 10)$: 30 on x-axis, 10 on y-axis
- $(50, 7)$: 50 on x-axis, 7 on y-axis
- $(70, 6)$: 70 on x-axis, 6 on y-axis
- $(90, 8)$: 90 on x-axis, 8 on y-axis
- $(110, 9)$: 110 on x-axis, 9 on y-axis

Snap & solve any problem in the app
Get step-by-step solutions on Sovi AI
Photo-based solutions with guided steps
Explore more problems and detailed explanations
A scatter plot with the following points plotted:
- (10, 21)
- (30, 10)
- (50, 7)
- (70, 6)
- (90, 8)
- (110, 9)
(When drawn on the provided grid, each point aligns with the corresponding speed and fuel use values on the axes.)