QUESTION IMAGE
Question
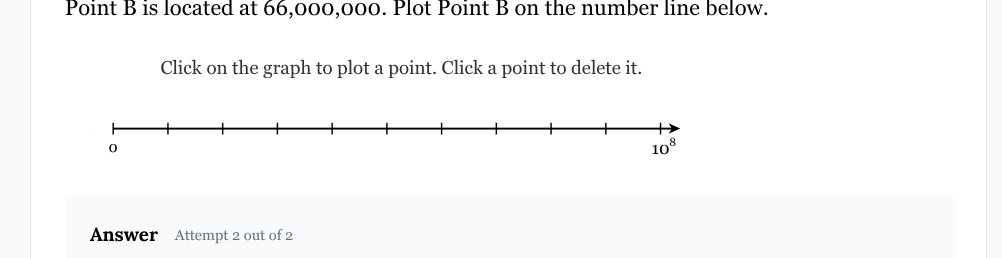
point b is located at 66,000,000. plot point b on the number line below.
click on the graph to plot a point. click a point to delete it.
answer attempt 2 out of 2
Step1: Analyze the number line scale
The number line goes from \(0\) to \(10^{8}\) (which is \(100,000,000\)). The total length of the number line is divided into equal intervals. Let's find the length of each interval. The number of intervals between \(0\) and \(10^{8}\) is \(10\) (since there are \(10\) marks from \(0\) to \(10^{8}\) including the endpoints? Wait, actually, looking at the number line, from \(0\) to \(10^{8}\), there are \(10\) segments? Wait, no, the number line has marks: let's count the number of units. The right end is \(10^{8}=100,000,000\), and the left end is \(0\). The distance between \(0\) and \(10^{8}\) is \(100,000,000\). If we assume the number line is divided into \(10\) equal parts (since there are \(10\) intervals between \(0\) and \(10^{8}\) as per the marks), then each interval has a length of \(\frac{100,000,000}{10}=10,000,000\) per interval.
Step2: Locate \(66,000,000\) on the number line
We know that each interval is \(10,000,000\). So, \(66,000,000\) divided by \(10,000,000\) is \(6.6\). So we need to plot the point \(6.6\) intervals from \(0\) towards \(10^{8}\). Alternatively, since \(60,000,000\) is \(6\) intervals (each of \(10,000,000\)) and \(66,000,000\) is \(6,000,000\) more than \(60,000,000\). Since each interval is \(10,000,000\), \(6,000,000\) is \(0.6\) of an interval. So we move \(6\) full intervals (to \(60,000,000\)) and then \(0.6\) of the next interval (which is from \(60,000,000\) to \(70,000,000\)).
But in terms of plotting, on the given number line, we can calculate the position. The value \(66,000,000\) is \(\frac{66,000,000}{100,000,000}=0.66\) of the way from \(0\) to \(10^{8}\). So we plot the point at \(66\%\) of the length of the number line from \(0\) towards \(10^{8}\).

Snap & solve any problem in the app
Get step-by-step solutions on Sovi AI
Photo-based solutions with guided steps
Explore more problems and detailed explanations
To plot Point B at \(66,000,000\) on the number line:
- The number line spans from \(0\) to \(10^{8}=100,000,000\).
- Each interval (between consecutive marks) has a length of \(\frac{100,000,000}{10}=10,000,000\).
- \(66,000,000\) is \(6\) full intervals (\(6\times10,000,000 = 60,000,000\)) plus \(0.6\) of the next interval (\(6,000,000\)).
- Click on the graph at the position \(6.6\) intervals from \(0\) (or \(66\%\) of the way from \(0\) to \(10^{8}\)) to plot Point B.
(Note: Since this is a click - to - plot interface, the key is to identify the correct position as described. The numerical value \(66,000,000\) corresponds to the point \(6.6\) units along the \(10\) - unit - scaled number line from \(0\) to \(10^{8}\).)