QUESTION IMAGE
Question
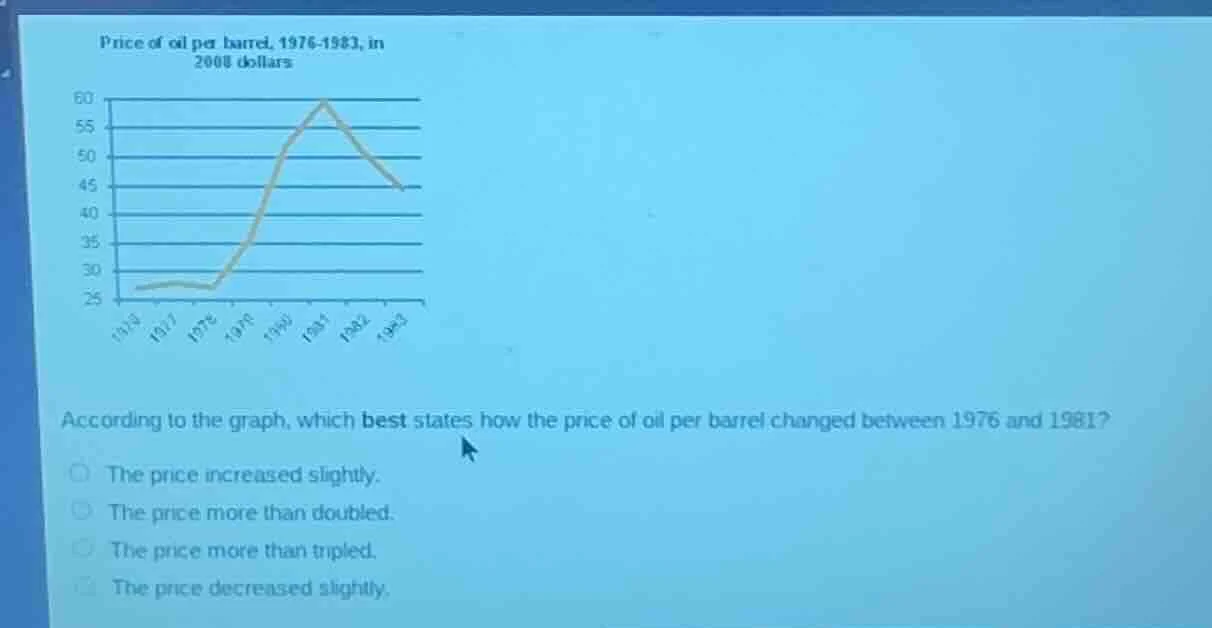
price of oil per barrel, 1976 - 1983, in 2008 dollars
according to the graph, which best states how the price of oil per barrel changed between 1976 and 1981?
- the price increased slightly.
- the price more than doubled.
- the price more than tripled.
- the price decreased slightly.
Brief Explanations
- From the graph, oil price in 1976 is ~$28 per barrel.
- In 1981, the price peaks at ~$60 per barrel.
- Calculate the ratio: $\frac{60}{28} \approx 2.14$, which is more than double, and less than triple. This matches the second option.

Snap & solve any problem in the app
Get step-by-step solutions on Sovi AI
Photo-based solutions with guided steps
Explore more problems and detailed explanations
The price more than doubled.