QUESTION IMAGE
Question
pring 2026
jakhiry arnold 02/09/26
ml 1.1 functions and models
question 10, 1.1.19
hw score: 34%, 6.8 of 20 points
points: 0 of 1
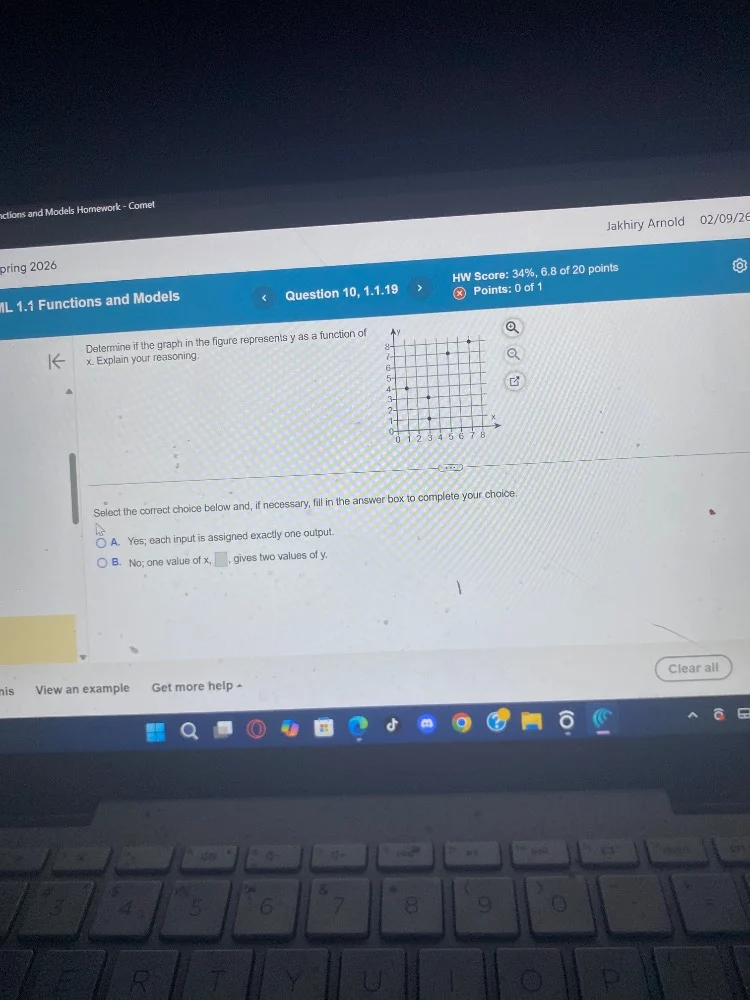
determine if the graph in the figure represents y as a function of x. explain your reasoning.
select the correct choice below and, if necessary, fill in the answer box to complete your choice.
a. yes; each input is assigned exactly one output.
b. no; one value of x gives two values of y.
is view an example get more help -
clear all
To determine if a graph represents y as a function of x, use the vertical line test: any vertical line drawn on the graph should intersect the graph at most once. Looking at the given graph, every x-value has exactly one corresponding y-value, so it passes the vertical line test.

Snap & solve any problem in the app
Get step-by-step solutions on Sovi AI
Photo-based solutions with guided steps
Explore more problems and detailed explanations
A. Yes; each input is assigned exactly one output.