QUESTION IMAGE
Question
question 8 of 10
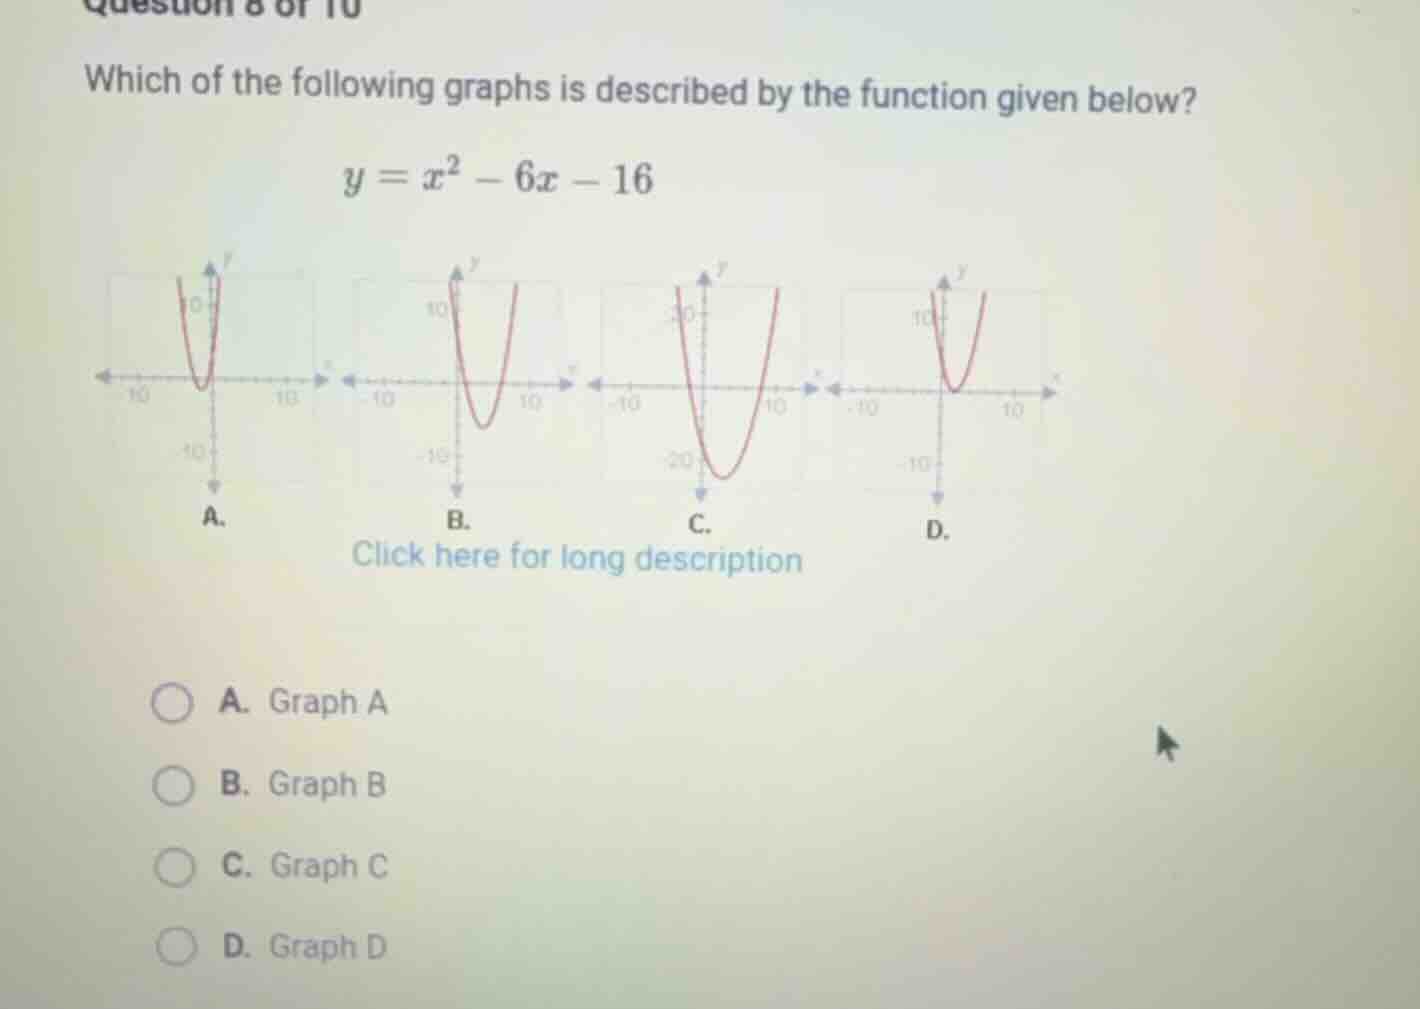
which of the following graphs is described by the function given below?
$y = x^2 - 6x - 16$
four graphs labeled a, b, c, d
a. graph a
b. graph b
c. graph c
d. graph d
click here for long description
Step1: Find the vertex of the parabola
The function is \( y = x^2 - 6x - 16 \). For a quadratic function \( y = ax^2+bx+c \), the x - coordinate of the vertex is \( x = -\frac{b}{2a} \). Here, \( a = 1 \), \( b=-6 \), so \( x=-\frac{-6}{2\times1}=3 \).
Substitute \( x = 3 \) into the function: \( y=(3)^2-6\times3 - 16=9 - 18-16=-25 \). So the vertex is \( (3,-25) \).
Step2: Find the y - intercept
The y - intercept occurs when \( x = 0 \). Substitute \( x = 0 \) into the function: \( y=0^2-6\times0 - 16=-16 \). So the y - intercept is \( (0,-16) \).
Step3: Analyze the graphs
- Graph A: The vertex seems to be on the x - axis and y - intercept is positive, which does not match.
- Graph B: The vertex is above \( y=-10 \) and y - intercept is positive, does not match.
- Graph C: The vertex is at \( (3,-25) \) (below \( y = - 20\)) and y - intercept is \( (0,-16) \), which matches our calculations.
- Graph D: The vertex is near the origin and y - intercept is positive, does not match.

Snap & solve any problem in the app
Get step-by-step solutions on Sovi AI
Photo-based solutions with guided steps
Explore more problems and detailed explanations
C. Graph C