QUESTION IMAGE
Question
question 2 3-4 cw
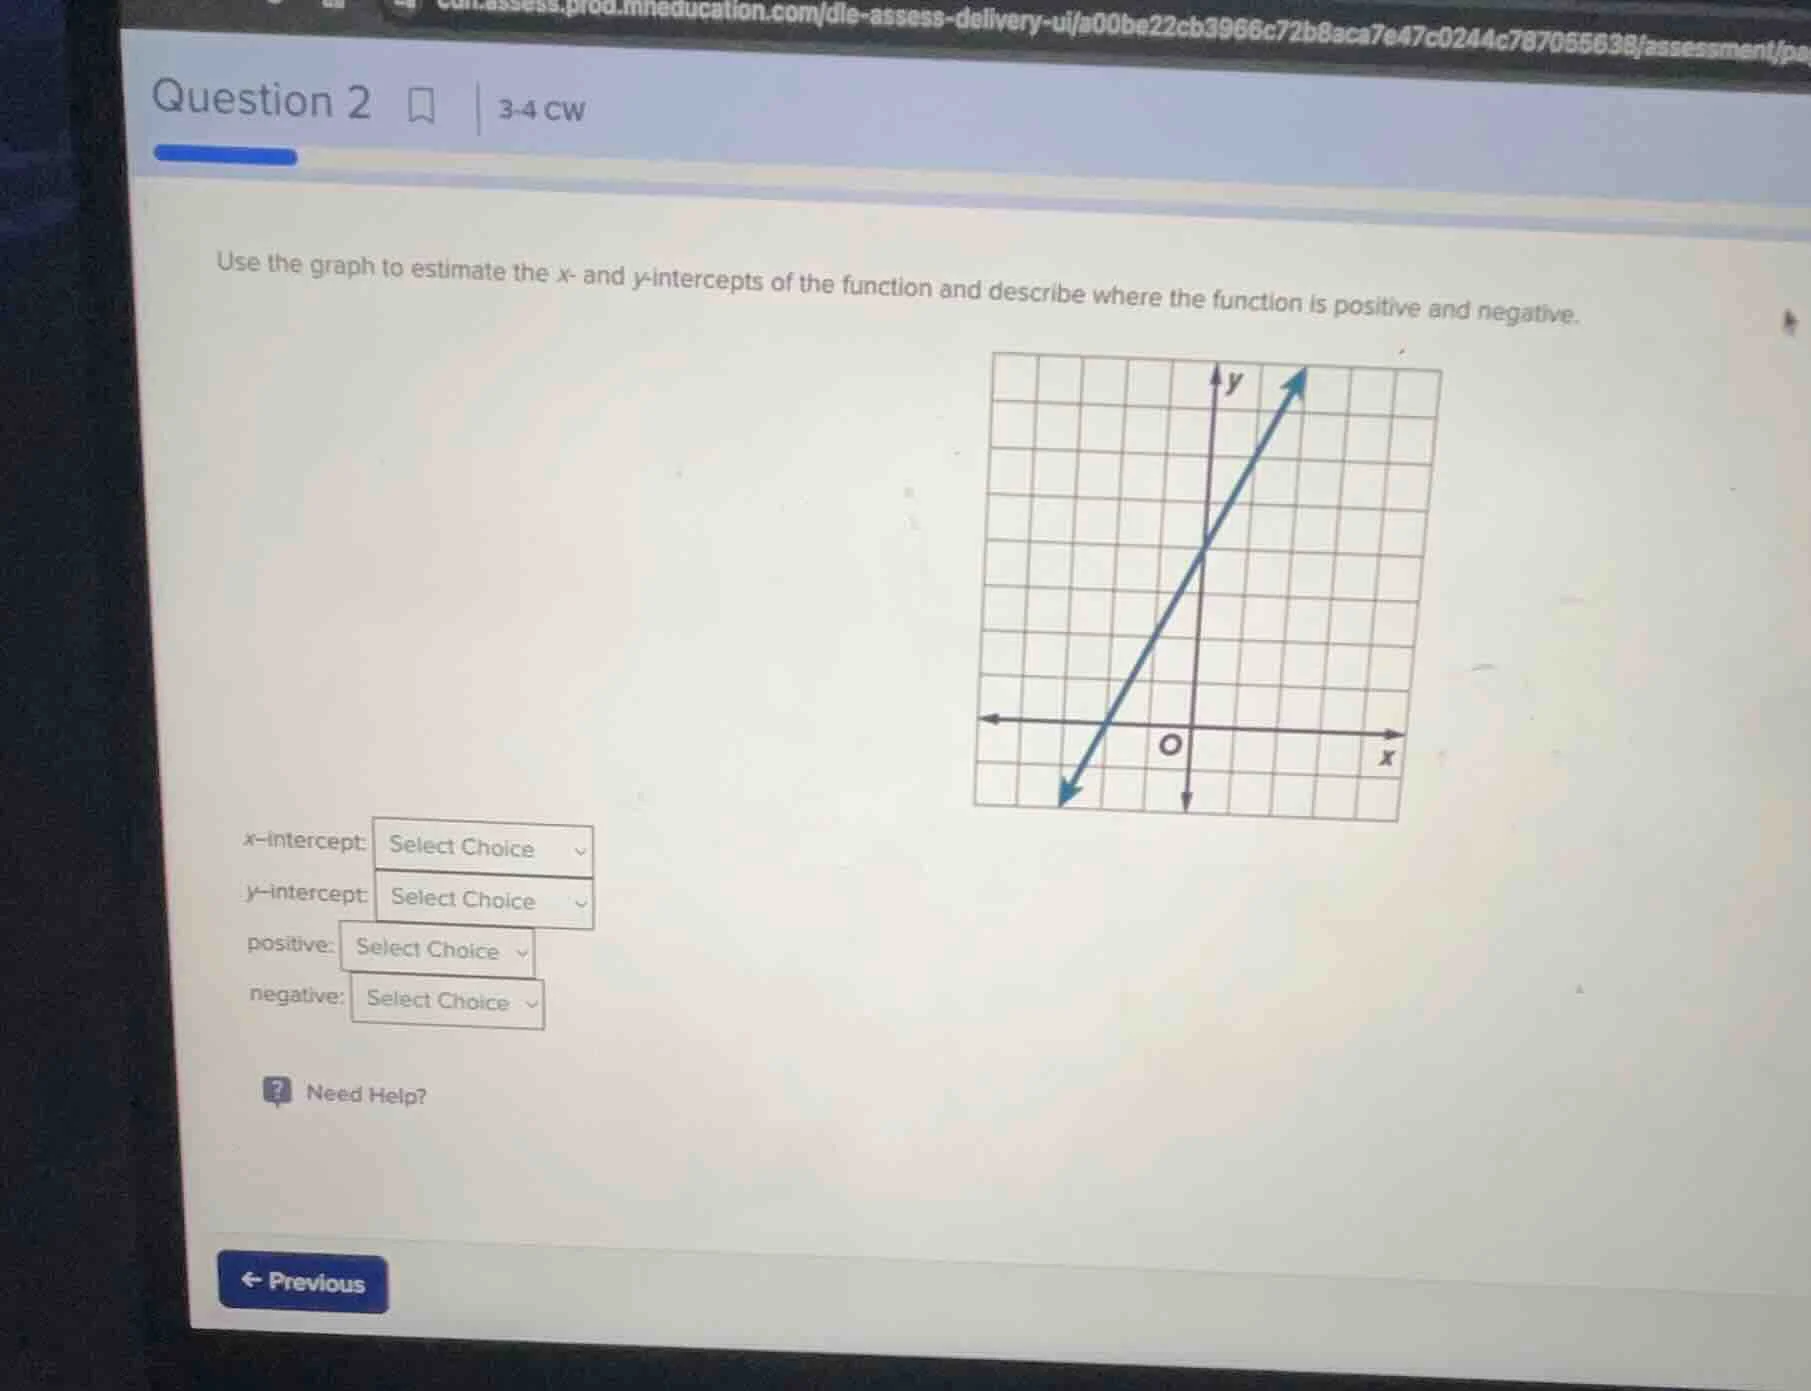
use the graph to estimate the x- and y-intercepts of the function and describe where the function is positive and negative.
x-intercept: select choice
y-intercept: select choice
positive: select choice
negative: select choice
need help?
Step1: Find x - intercept
The x - intercept is the point where the graph crosses the x - axis. From the graph, we can see that the line crosses the x - axis at \(x=-2\) (assuming each grid square is 1 unit). So the x - intercept is \((-2,0)\).
Step2: Find y - intercept
The y - intercept is the point where the graph crosses the y - axis. From the graph, the line crosses the y - axis at \(y = 4\) (assuming each grid square is 1 unit). So the y - intercept is \((0,4)\).
Step3: Determine where the function is positive
A function is positive when its \(y\) - values are greater than 0. Looking at the graph, the line is above the x - axis (where \(y>0\)) when \(x>-2\).
Step4: Determine where the function is negative
A function is negative when its \(y\) - values are less than 0. Looking at the graph, the line is below the x - axis (where \(y < 0\)) when \(x<-2\).

Snap & solve any problem in the app
Get step-by-step solutions on Sovi AI
Photo-based solutions with guided steps
Explore more problems and detailed explanations
x - intercept: \((-2,0)\); y - intercept: \((0,4)\); positive: \(x > - 2\); negative: \(x < - 2\)