QUESTION IMAGE
Question
question
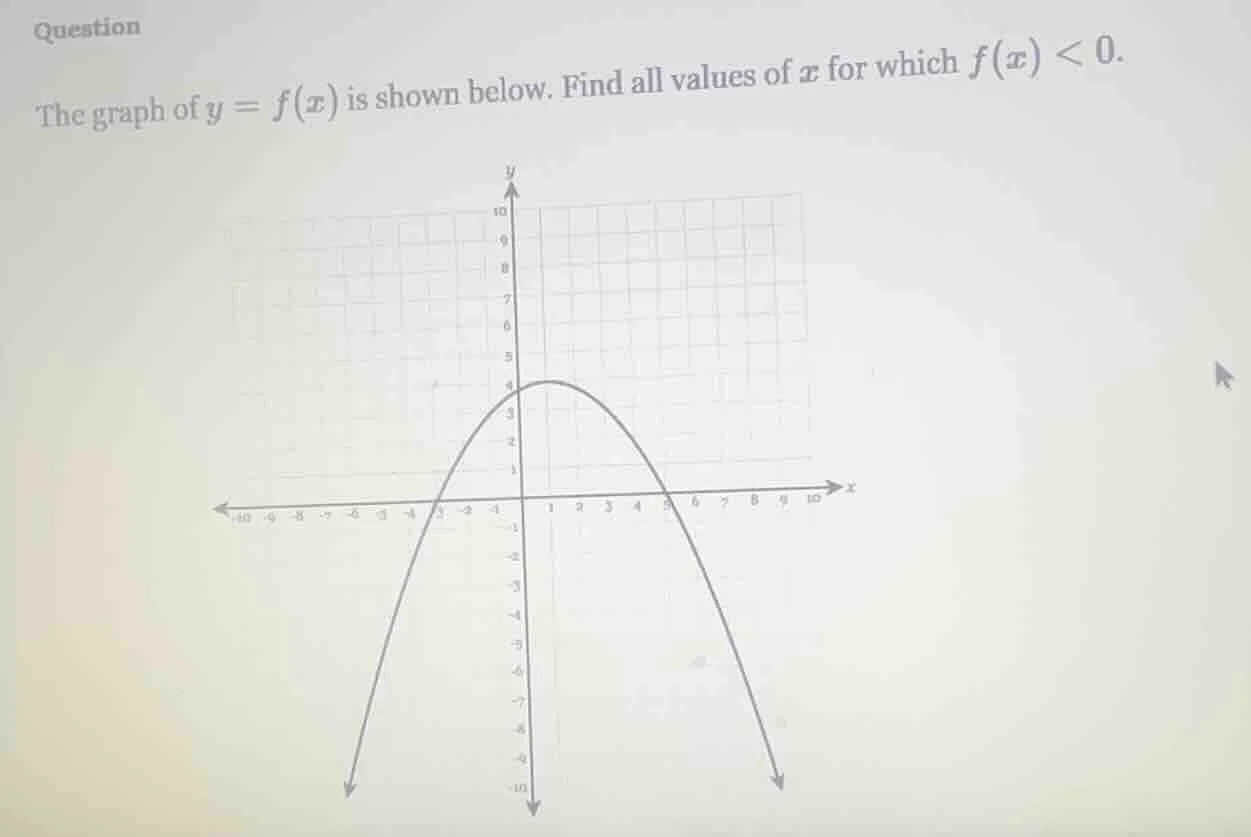
the graph of $y = f(x)$ is shown below. find all values of $x$ for which $f(x) < 0$.
Step1: Identify x-intercepts
The parabola crosses the x-axis at $x=-2$ and $x=5$.
Step2: Determine where $f(x)<0$
$f(x)<0$ means the graph is below the x-axis. This occurs when $x < -2$ or $x > 5$.

Snap & solve any problem in the app
Get step-by-step solutions on Sovi AI
Photo-based solutions with guided steps
Explore more problems and detailed explanations
All real numbers $x$ such that $x < -2$ or $x > 5$, or in interval notation: $(-\infty, -2) \cup (5, \infty)$