QUESTION IMAGE
Question
question
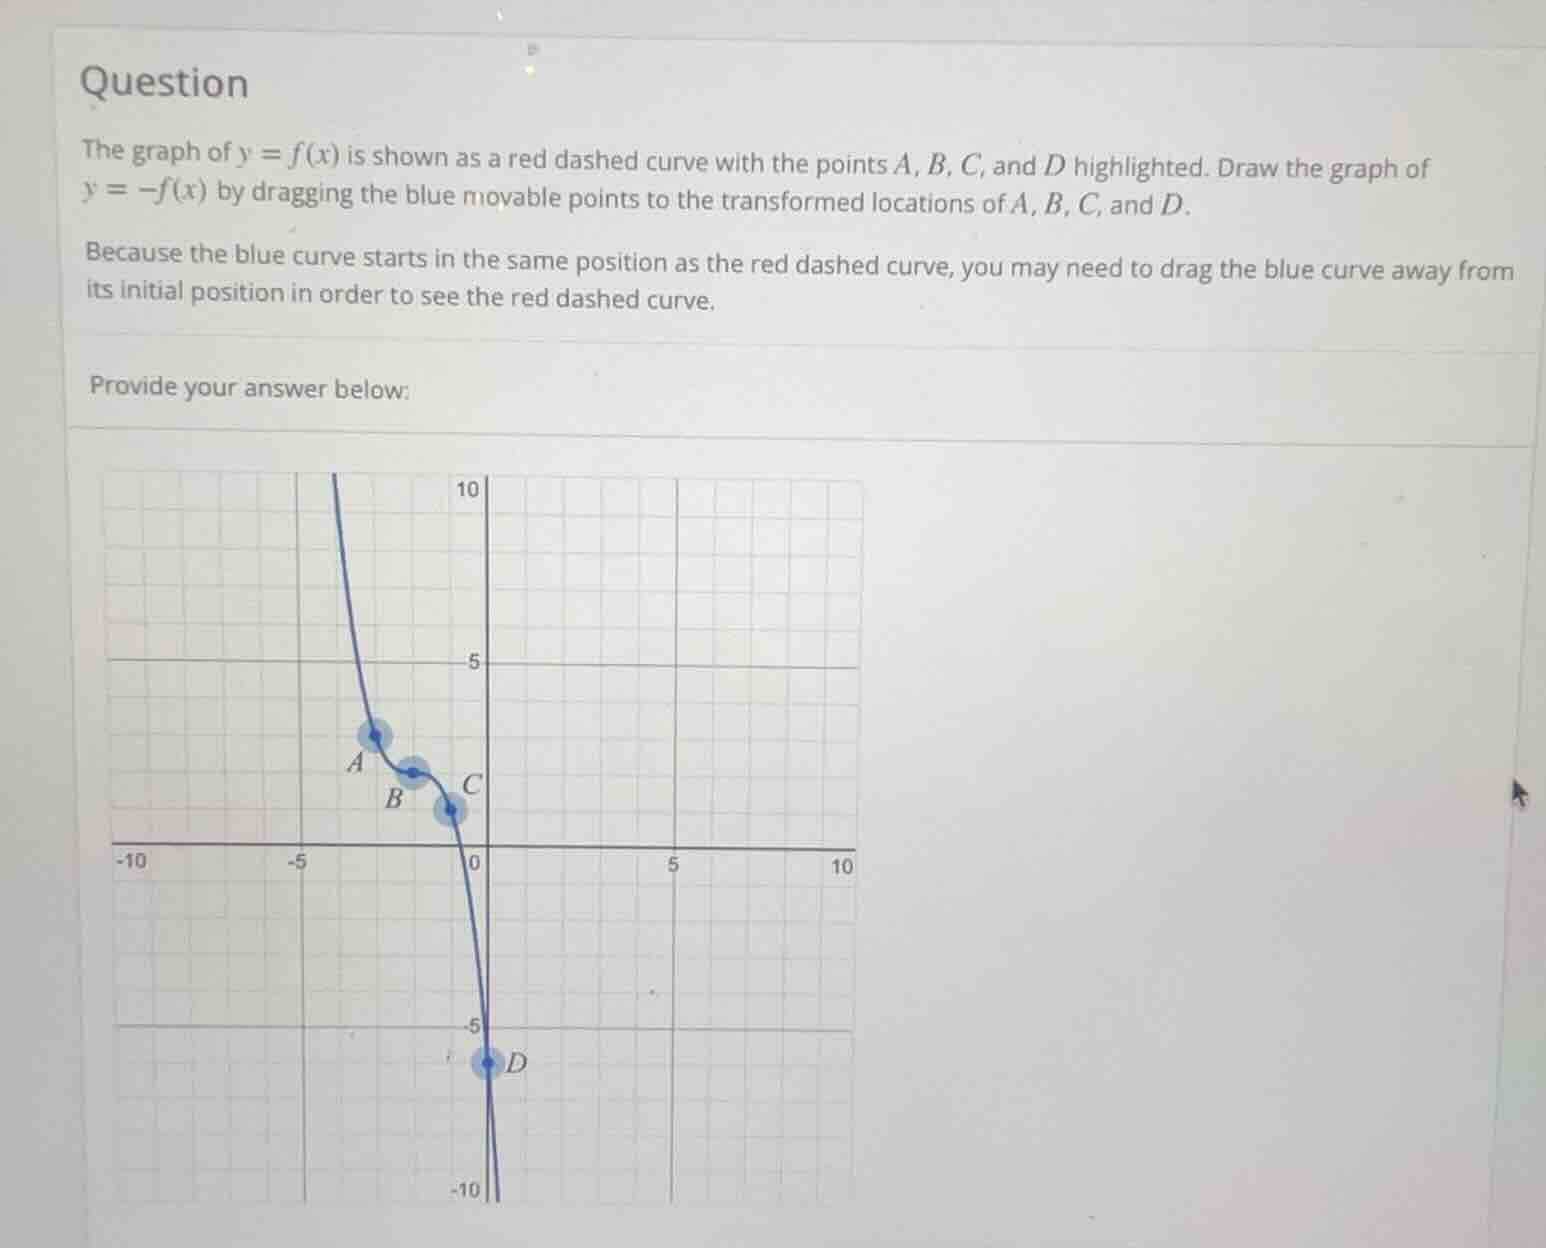
the graph of ( y = f(x) ) is shown as a red dashed curve with the points ( a, b, c, ) and ( d ) highlighted. draw the graph of ( y = -f(x) ) by dragging the blue movable points to the transformed locations of ( a, b, c, ) and ( d ).
because the blue curve starts in the same position as the red dashed curve, you may need to drag the blue curve away from its initial position in order to see the red dashed curve.
provide your answer below:
Step1: Understand the transformation
The transformation \( y = -f(x) \) is a reflection over the \( x \)-axis. For a point \( (x, y) \) on \( y = f(x) \), the corresponding point on \( y = -f(x) \) will be \( (x, -y) \).
Step2: Transform each point
- Let's assume the coordinates of point \( A \) are \( (x_A, y_A) \). Then the transformed point \( A' \) for \( y = -f(x) \) will be \( (x_A, -y_A) \).
- Similarly, for point \( B \) with coordinates \( (x_B, y_B) \), the transformed point \( B' \) is \( (x_B, -y_B) \).
- For point \( C \) with coordinates \( (x_C, y_C) \), the transformed point \( C' \) is \( (x_C, -y_C) \).
- For point \( D \) with coordinates \( (x_D, y_D) \), the transformed point \( D' \) is \( (x_D, -y_D) \).
Step3: Drag the points
Drag each blue movable point (A, B, C, D) to their respective transformed positions \( (x, -y) \) where \( (x, y) \) is their original position on the red dashed curve.

Snap & solve any problem in the app
Get step-by-step solutions on Sovi AI
Photo-based solutions with guided steps
Explore more problems and detailed explanations
To draw the graph of \( y = -f(x) \), reflect each of the points A, B, C, and D over the \( x \)-axis. That is, for each point \( (x, y) \) on \( y = f(x) \), move it to \( (x, -y) \) on the blue curve.