QUESTION IMAGE
Question
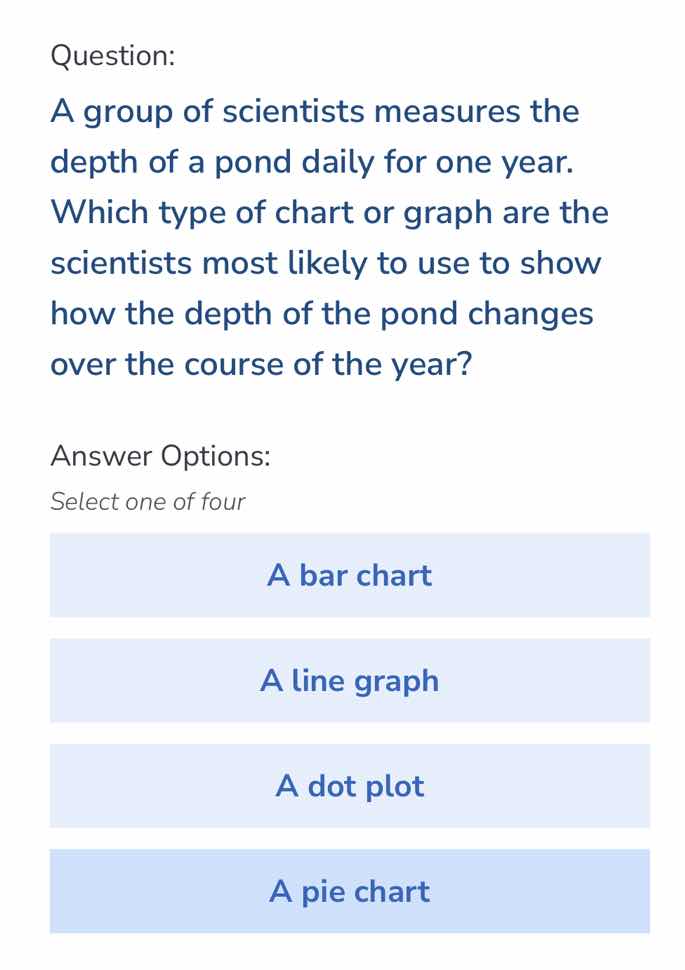
question:
a group of scientists measures the
depth of a pond daily for one year.
which type of chart or graph are the
scientists most likely to use to show
how the depth of the pond changes
over the course of the year?
answer options:
select one of four
a bar chart
a line graph
a dot plot
a pie chart
To determine the appropriate chart, we analyze the purpose: showing how pond depth changes over time. A line graph is ideal for displaying trends over a continuous variable (time here). Bar charts compare categories, dot plots show individual data points' distribution, and pie charts show proportions—none suit trend over time as well as a line graph.

Snap & solve any problem in the app
Get step-by-step solutions on Sovi AI
Photo-based solutions with guided steps
Explore more problems and detailed explanations
B. A line graph