QUESTION IMAGE
Question
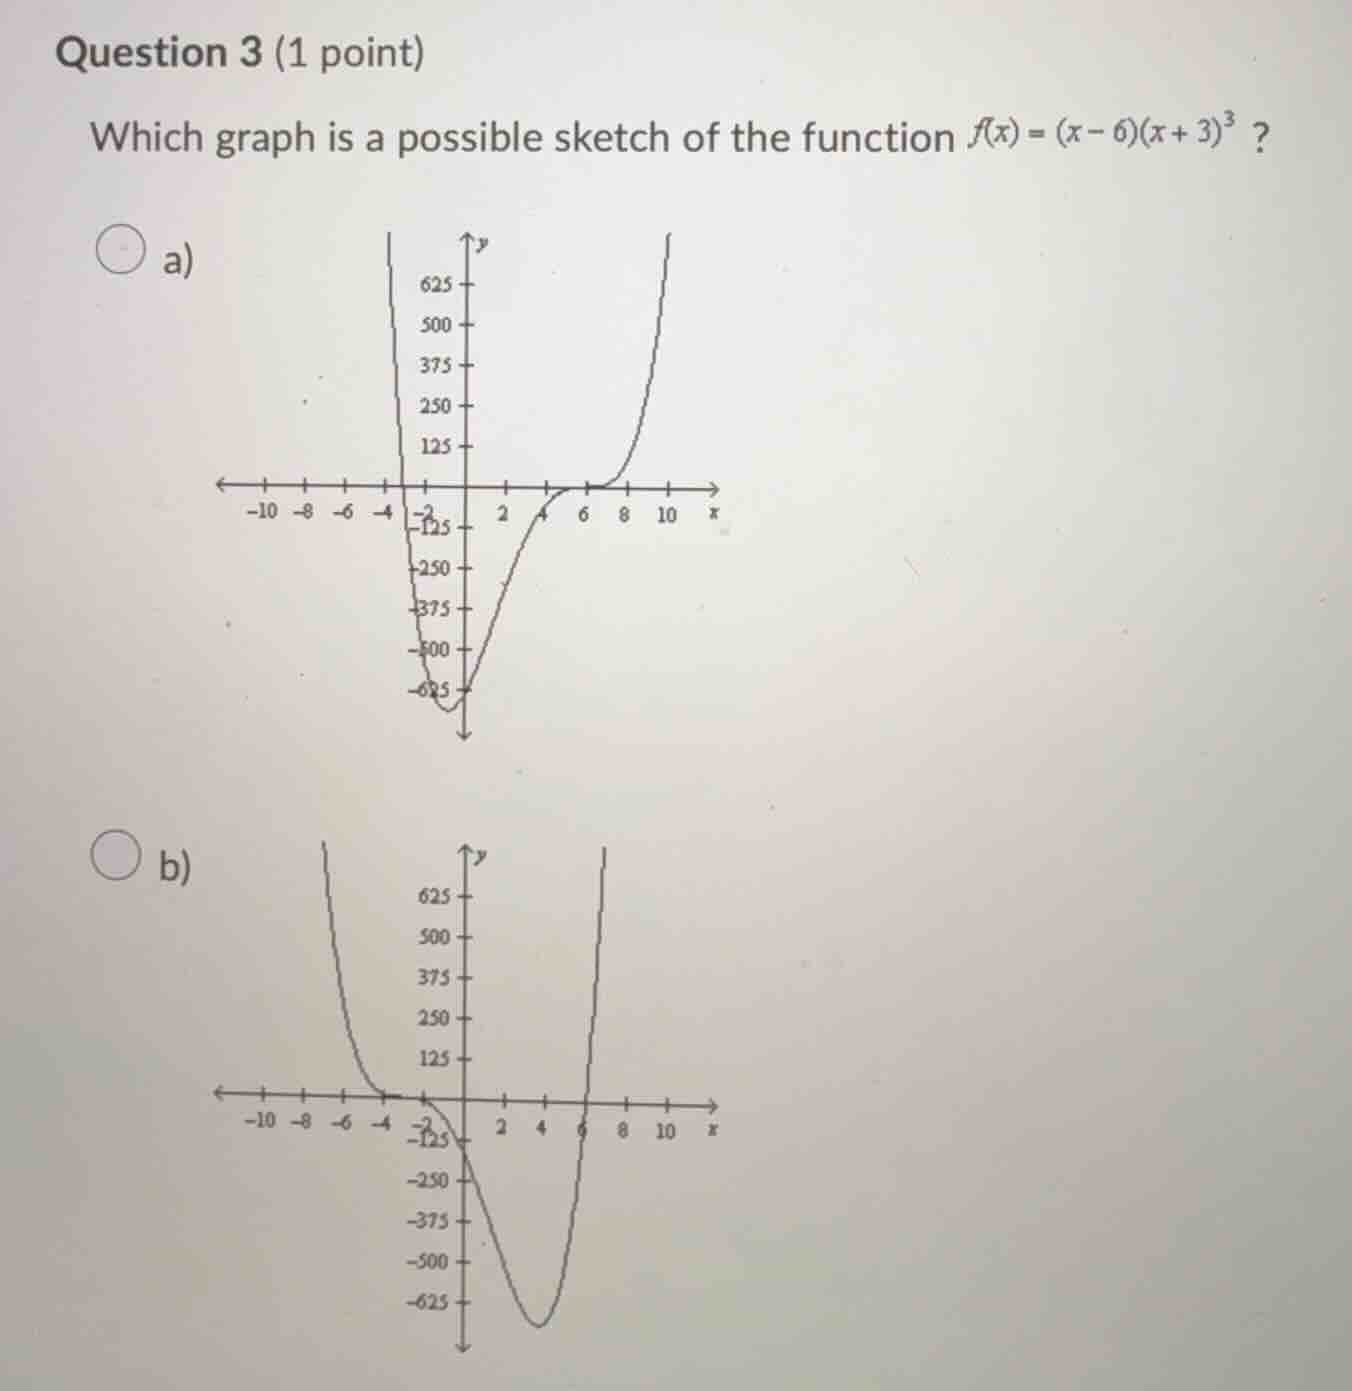
question 3 (1 point)
which graph is a possible sketch of the function $f(x) = (x - 6)(x + 3)^3$?
\bigcirc a)
\
\bigcirc b)
\
Step1: Find x-intercepts
Set $f(x)=0$, solve $(x-6)(x+3)^3=0$.
Solutions: $x=6$ (multiplicity 1), $x=-3$ (multiplicity 3)
Step2: Analyze intercept behavior
- For $x=6$ (odd multiplicity 1): graph crosses x-axis.
- For $x=-3$ (odd multiplicity 3): graph crosses x-axis, with a flatter shape near the intercept (due to higher odd multiplicity).
Step3: Test sign of $f(x)$
- For $x < -3$ (e.g., $x=-4$): $f(-4)=(-4-6)(-4+3)^3=(-10)(-1)=10>0$, so graph is above x-axis.
- For $-3 < x < 6$ (e.g., $x=0$): $f(0)=(0-6)(0+3)^3=(-6)(27)=-162<0$, so graph is below x-axis.
- For $x > 6$ (e.g., $x=7$): $f(7)=(7-6)(7+3)^3=(1)(1000)=1000>0$, so graph is above x-axis.
Step4: Match to given graphs
Graph b) is above x-axis when $x < -3$, crosses x-axis at $x=-3$, is below x-axis between $-3$ and $6$, crosses x-axis at $x=6$, and is above x-axis when $x > 6$, which matches all properties.

Snap & solve any problem in the app
Get step-by-step solutions on Sovi AI
Photo-based solutions with guided steps
Explore more problems and detailed explanations
b) <The graph that is above the x-axis for $x < -3$, crosses the x-axis at $x=-3$, dips below the x-axis between $-3$ and $6$, crosses the x-axis at $x=6$, and rises above the x-axis for $x > 6$>