QUESTION IMAGE
Question
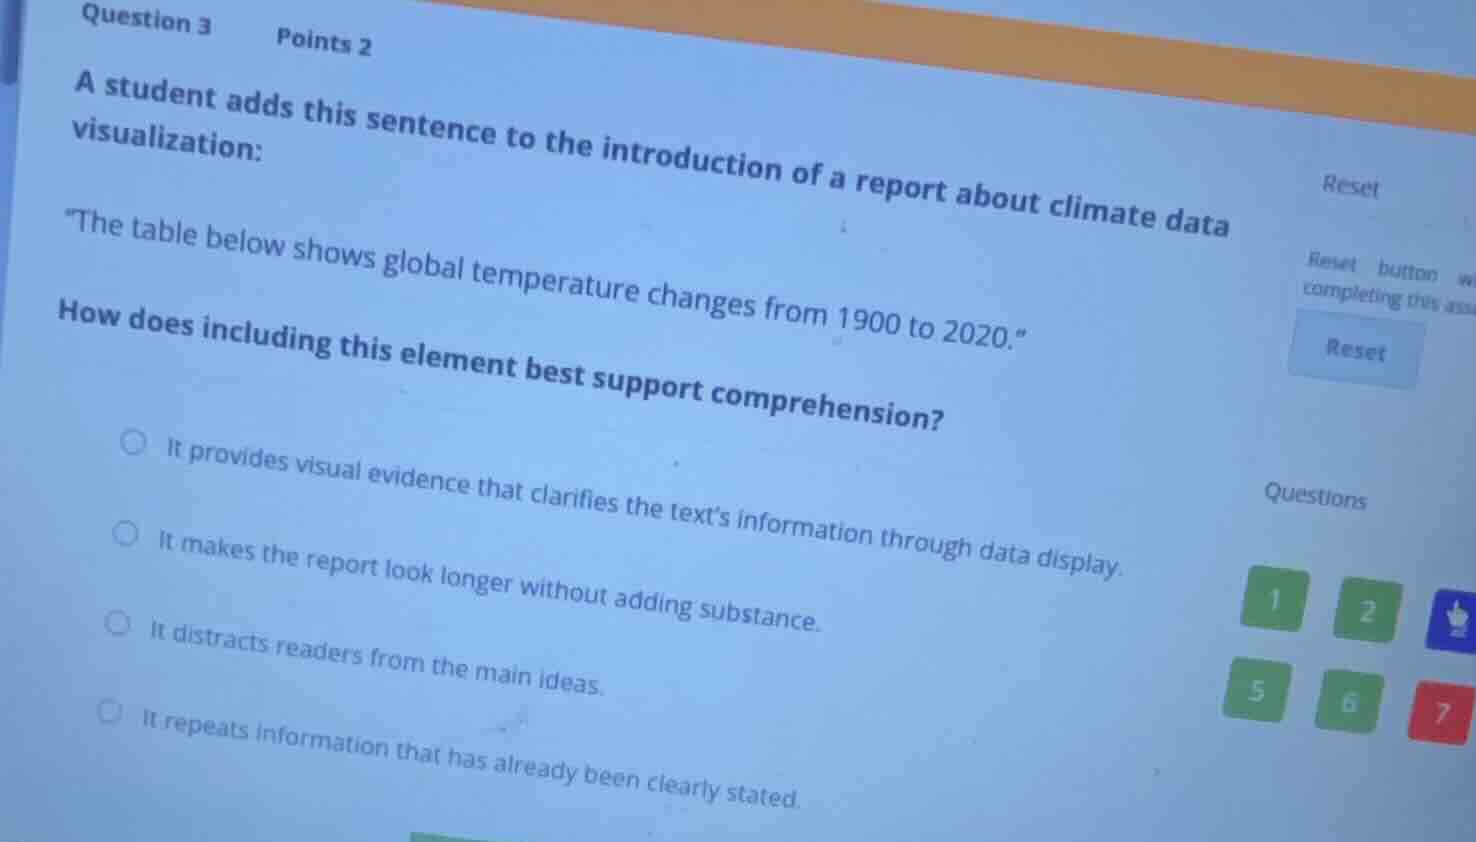
question 3 points 2 a student adds this sentence to the introduction of a report about climate data visualization: \the table below shows global temperature changes from 1900 to 2020.\ how does including this element best support comprehension? it provides visual evidence that clarifies the text’s information through data display. it makes the report look longer without adding substance. it distracts readers from the main ideas. it repeats information that has already been clearly stated.
To determine the correct answer, we analyze each option:
- Option 1: A table showing global temperature changes from 1900 to 2020 provides visual evidence (in the form of data display) that clarifies the text's information about climate data. This aligns with how data visualizations support comprehension.
- Option 2: A table is added to add substance (data) to the report, not to make it look longer without substance.
- Option 3: A table with relevant data about the topic (climate data) does not distract from main ideas; it supports them.
- Option 4: The sentence introduces the table, and the table presents new data (temperature changes over time), so it is not repeating already - stated information.

Snap & solve any problem in the app
Get step-by-step solutions on Sovi AI
Photo-based solutions with guided steps
Explore more problems and detailed explanations
It provides visual evidence that clarifies the text’s information through data display.