QUESTION IMAGE
Question
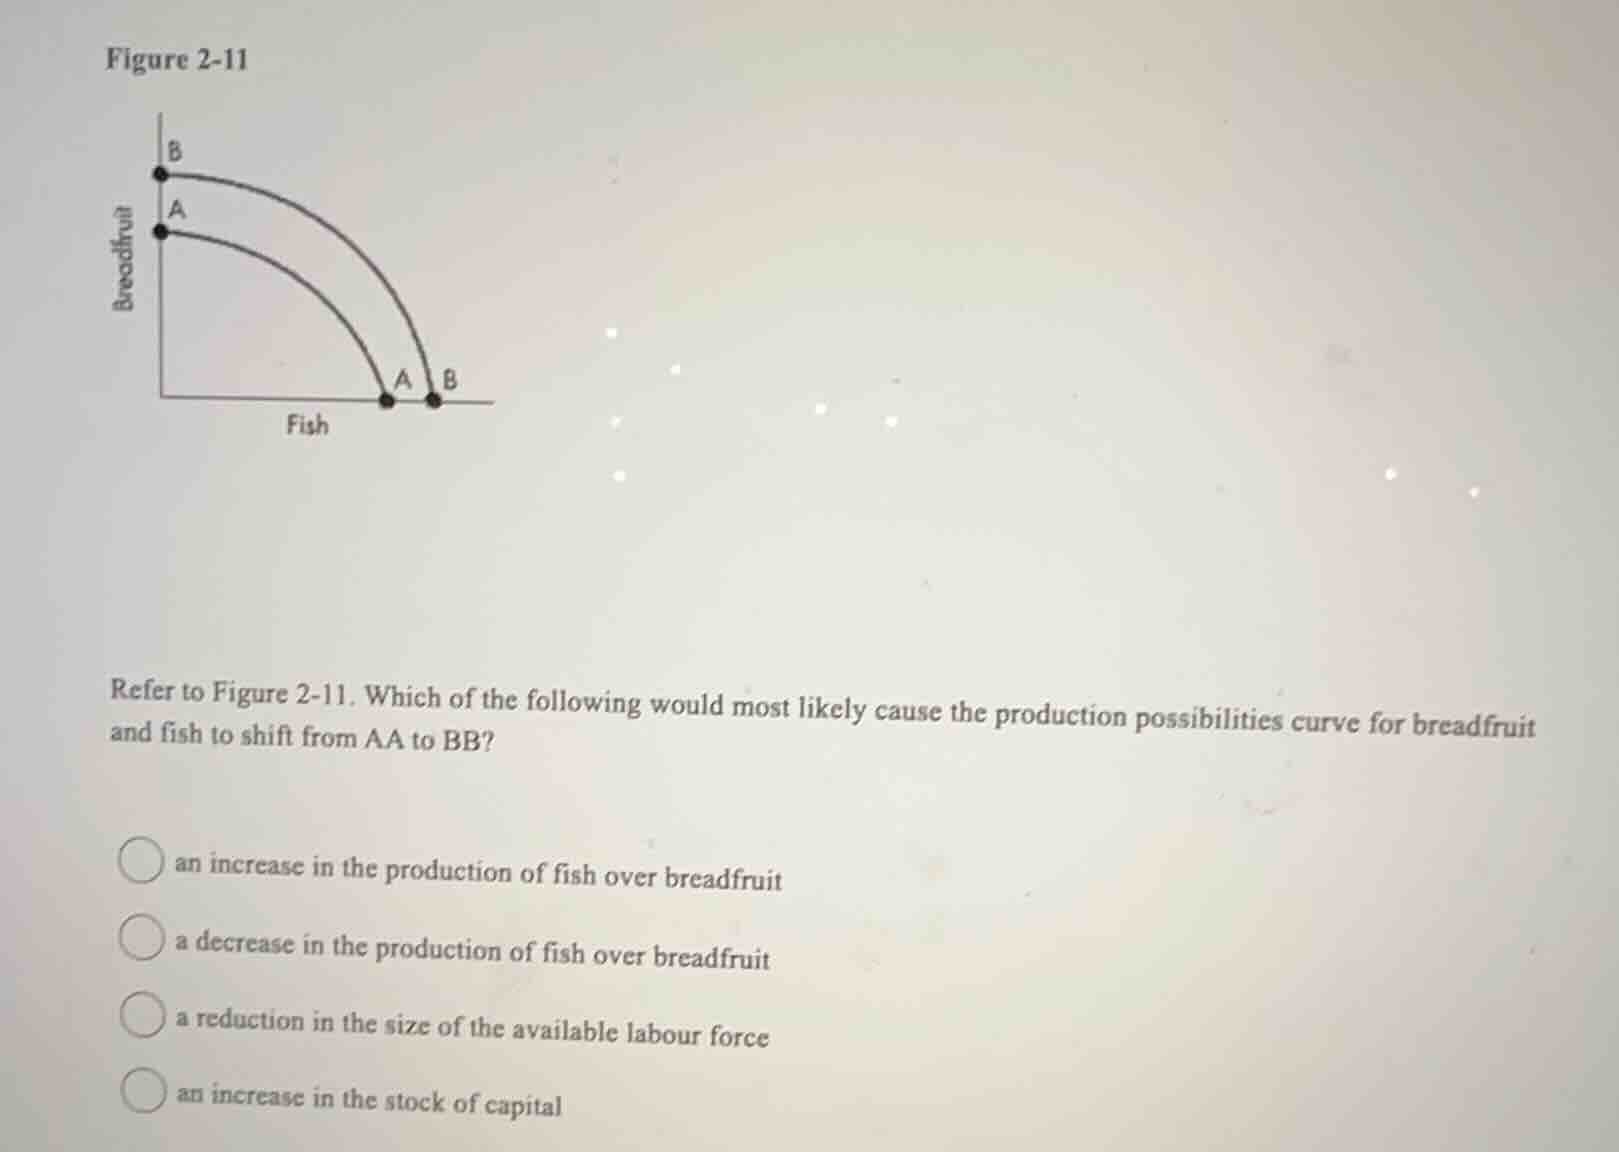
refer to figure 2-11. which of the following would most likely cause the production possibilities curve for breadfruit and fish to shift from aa to bb? an increase in the production of fish over breadfruit a decrease in the production of fish over breadfruit a reduction in the size of the available labour force an increase in the stock of capital
Brief Explanations
A shift outward of the production possibilities curve (from AA to BB) represents an increase in an economy's productive capacity, meaning it can produce more of both goods (breadfruit and fish).
- The first two options describe a reallocation of production between the two goods, which is a movement along the existing curve, not a shift.
- A reduction in the labor force would decrease productive capacity, shifting the curve inward, not outward.
- An increase in the stock of capital expands the economy's resources and ability to produce more of both goods, causing an outward shift of the curve.

Snap & solve any problem in the app
Get step-by-step solutions on Sovi AI
Photo-based solutions with guided steps
Explore more problems and detailed explanations
an increase in the stock of capital