QUESTION IMAGE
Question
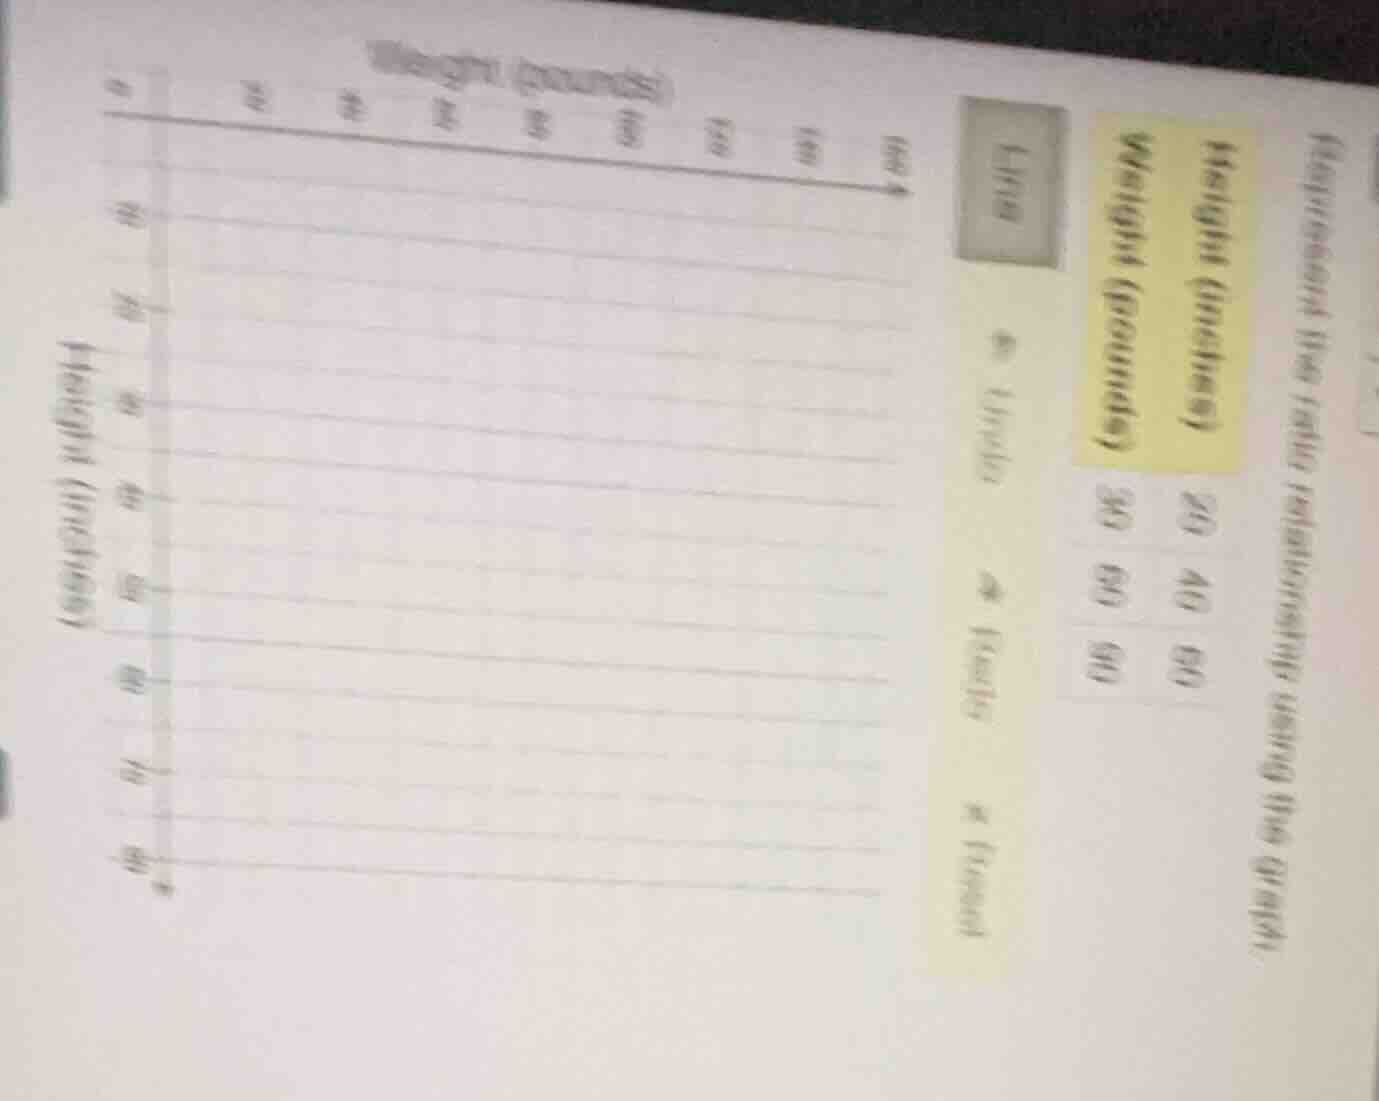
represent the ratio relationship using the graph.
height (inches) weight (pounds)
♦ linda 20 30
♦ katie 40 60
× freddy 60 90
graph with x - axis labeled weight (pounds) from 0 to 100 and y - axis labeled height (inches) from 30 to 90
Step1: Identify coordinate pairs
The pairs are $(20,30)$, $(40,60)$, $(60,90)$ where $x$ = Height (inches), $y$ = Weight (pounds)
Step2: Plot points on the graph
Mark each pair: $(20,30)$: x=20, y=30; $(40,60)$: x=40, y=60; $(60,90)$: x=60, y=90
Step3: Draw the trend line
Connect the plotted points with a straight line, extending it to cover the graph's range.
Step4: Verify the relationship
Check the ratio $\frac{\text{Weight}}{\text{Height}} = \frac{30}{20} = \frac{60}{40} = \frac{90}{60} = 1.5$, so it is a proportional linear relationship.

Snap & solve any problem in the app
Get step-by-step solutions on Sovi AI
Photo-based solutions with guided steps
Explore more problems and detailed explanations
- Plot the points (20, 30), (40, 60), and (60, 90) on the provided graph (with Height on the x-axis, Weight on the y-axis).
- Draw a straight line passing through all three points (and extending along the same slope) to represent the proportional ratio relationship.