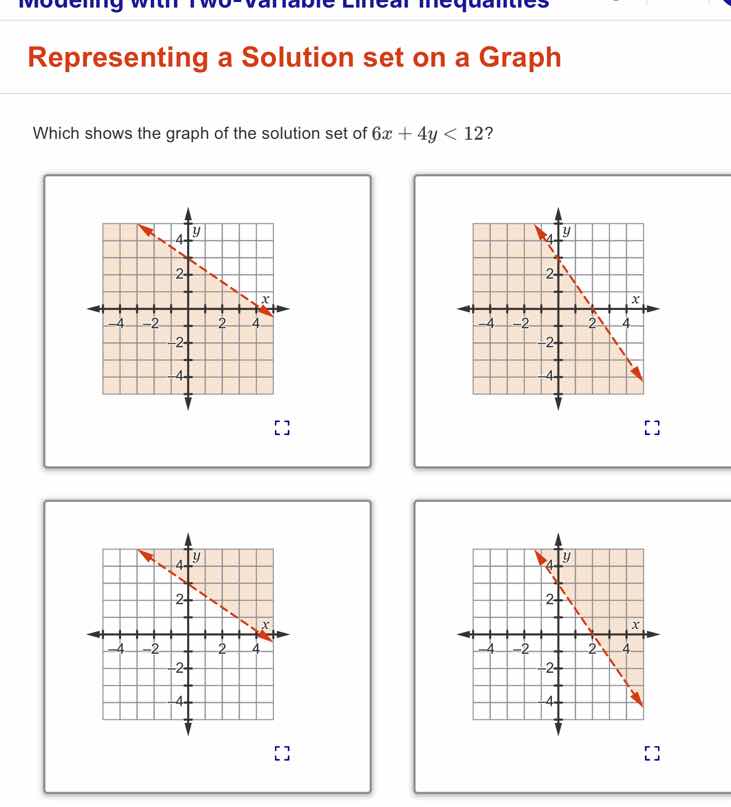
QUESTION IMAGE
Question
representing a solution set on a graph
which shows the graph of the solution set of ( 6x + 4y < 12 )?
Step1: Rewrite the inequality in slope - intercept form
We start with the inequality \(6x + 4y<12\). To get it in the form \(y = mx + b\) (slope - intercept form), we solve for \(y\).
Subtract \(6x\) from both sides: \(4y<-6x + 12\).
Then divide each term by \(4\): \(y<-\frac{6}{4}x+\frac{12}{4}\), which simplifies to \(y<-\frac{3}{2}x + 3\).
Step2: Analyze the boundary line
The boundary line for the inequality \(y<-\frac{3}{2}x + 3\) is the line \(y =-\frac{3}{2}x+3\). Since the inequality is strict (\(<\) instead of \(\leq\)), the boundary line should be a dashed line.
To find the \(x\) - intercept, set \(y = 0\): \(0=-\frac{3}{2}x + 3\).
Add \(\frac{3}{2}x\) to both sides: \(\frac{3}{2}x=3\).
Multiply both sides by \(\frac{2}{3}\): \(x = 2\). So the \(x\) - intercept is \((2,0)\).
To find the \(y\) - intercept, set \(x = 0\): \(y=-\frac{3}{2}(0)+3=3\). So the \(y\) - intercept is \((0,3)\).
Step3: Determine the region of the solution
We use the test point \((0,0)\) (since it is not on the line \(y =-\frac{3}{2}x + 3\)). Substitute \(x = 0\) and \(y = 0\) into the inequality \(y<-\frac{3}{2}x + 3\):
\(0<-\frac{3}{2}(0)+3\), which simplifies to \(0 < 3\). This is a true statement. So the region that contains the point \((0,0)\) is part of the solution set.
Now let's analyze the four graphs:
- The slope of the line \(y =-\frac{3}{2}x + 3\) is negative (\(-\frac{3}{2}\)), so the line should be decreasing from left to right.
- The \(x\) - intercept is \((2,0)\) and \(y\) - intercept is \((3,0)\) (wait, \(y\) - intercept is \((0,3)\)).
- Since the test point \((0,0)\) satisfies the inequality, and \((0,0)\) is below the line \(y =-\frac{3}{2}x + 3\) (because when \(x = 0\), \(y = 0<3\)), we need to find the graph where the dashed line has \(x\) - intercept \((2,0)\), \(y\) - intercept \((0,3)\), is decreasing, and the shaded region includes \((0,0)\).
Looking at the four graphs, the second graph (top - right) has a dashed line with \(x\) - intercept around \(2\), \(y\) - intercept around \(3\), is decreasing, and the shaded region (the area below the line) includes \((0,0)\) (since when we look at the graph, the origin is in the shaded area). The first graph has a line with \(x\) - intercept \(4\) (which is wrong, our \(x\) - intercept is \(2\)), the third graph has a shaded region above the line (which would not include \((0,0)\) since \((0,0)\) is below the line \(y =-\frac{3}{2}x + 3\) when \(x = 0\), \(y = 0<3\)), and the fourth graph has a shaded region that does not seem to include \((0,0)\) correctly.

Snap & solve any problem in the app
Get step-by-step solutions on Sovi AI
Photo-based solutions with guided steps
Explore more problems and detailed explanations
The top - right graph (the second graph in the given set of four graphs)