QUESTION IMAGE
Question
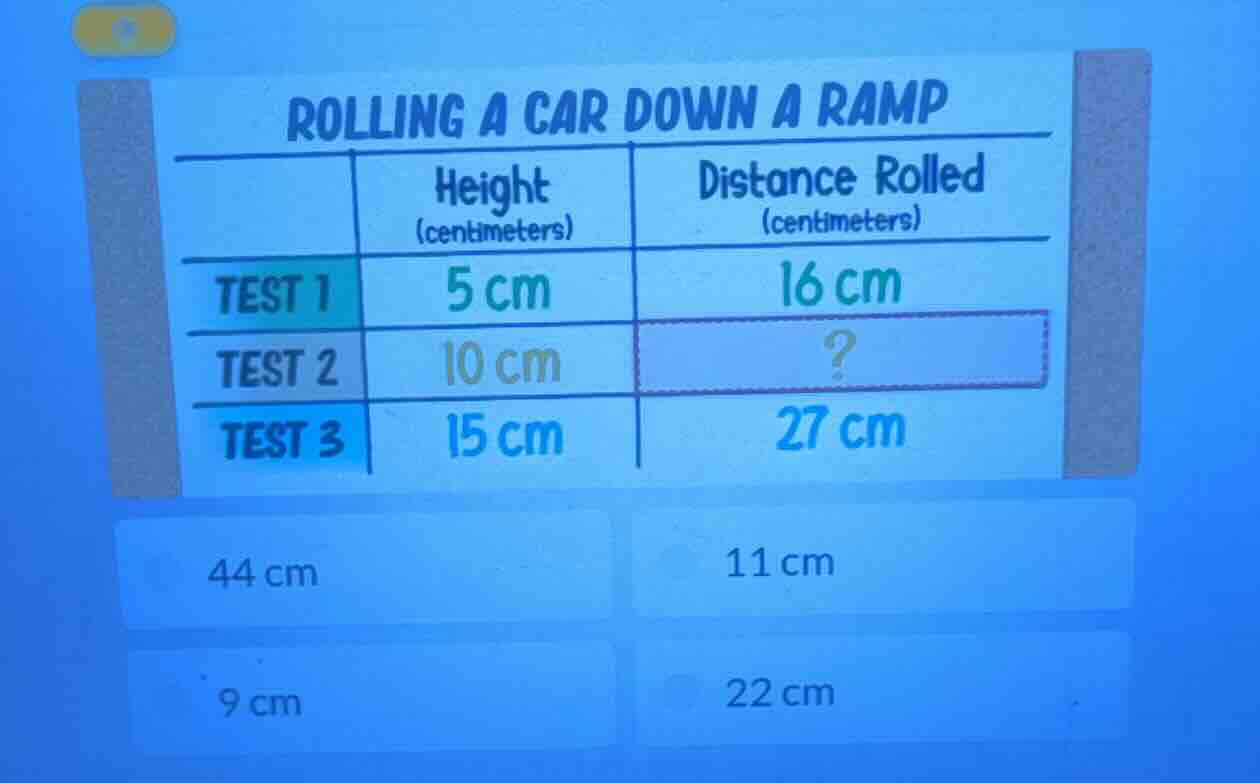
rolling a car down a ramp
| height (centimeters) | distance rolled (centimeters) | |
| test 1 | 5 cm | 16 cm |
| test 2 | 10 cm | ? |
| test 3 | 15 cm | 27 cm |
44 cm
11 cm
9 cm
22 cm
Step1: Analyze the relationship
We can assume a linear relationship between height and distance rolled. Let's check the differences. From Test 1 (5 cm height, 16 cm distance) to Test 3 (15 cm height, 27 cm distance), the height increases by \(15 - 5=10\) cm and the distance increases by \(27 - 16 = 11\) cm? Wait, maybe better to find the average rate. The height increases by 5 cm each test (from 5 to 10 to 15). Let's see the change in distance. From Test 1 to Test 3, 2 tests (5 cm each), distance from 16 to 27, change of 11? Wait, maybe linear approximation. Let the distance \(d\) and height \(h\). We can use the two known points \((5,16)\) and \((15,27)\) to find the slope \(m=\frac{27 - 16}{15 - 5}=\frac{11}{10} = 1.1\) cm per cm height. Then for \(h = 10\) cm, \(d=16+(10 - 5)\times1.1=16 + 5.5 = 21.5\)? Wait, no, maybe the options are 22, which is close. Alternatively, check the sum or average. Test 1: 5, 16; Test 3:15,27. The midpoint of height is 10 (since 5 and 15 average to 10), so midpoint of distance should be \(\frac{16 + 27}{2}=\frac{43}{2}=21.5\), closest to 22.
Step2: Verify with options
The options are 44,11,9,22. 22 is the closest to the midpoint or linear approximation.

Snap & solve any problem in the app
Get step-by-step solutions on Sovi AI
Photo-based solutions with guided steps
Explore more problems and detailed explanations
22 cm (the option with 22 cm)