QUESTION IMAGE
Question
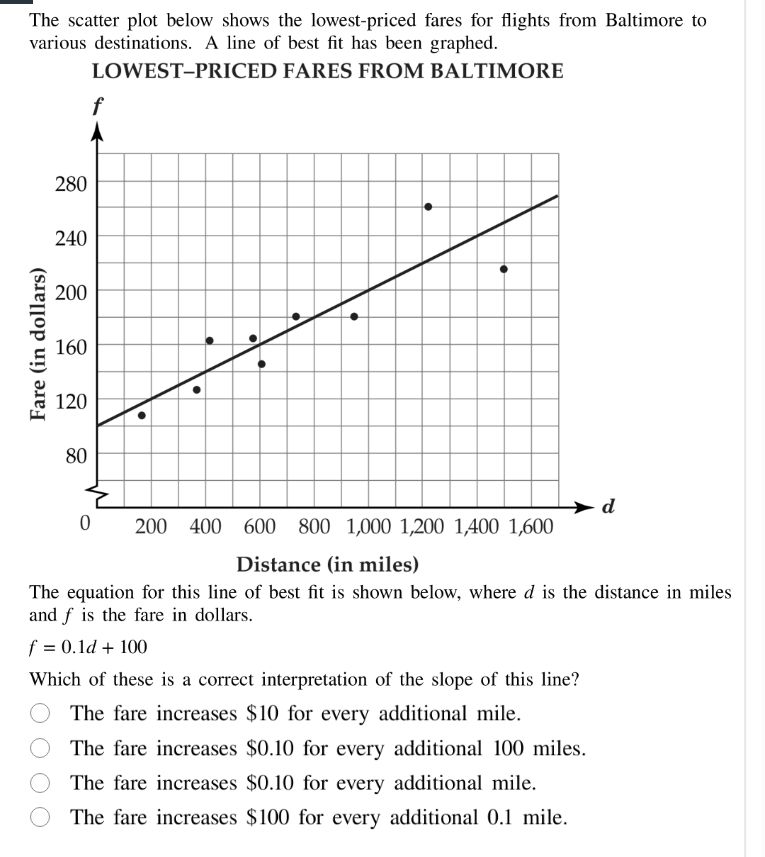
the scatter plot below shows the lowest - priced fares for flights from baltimore to various destinations. a line of best fit has been graphed.\
lowest - priced fares from baltimore\
the equation for this line of best fit is shown below, where ( d ) is the distance in miles and ( f ) is the fare in dollars.\
( f = 0.1d+100 )\
which of these is a correct interpretation of the slope of this line?\
\\( \bigcirc \\) the fare increases \\$10 for every additional mile.\
\\( \bigcirc \\) the fare increases \\$0.10 for every additional 100 miles.\
\\( \bigcirc \\) the fare increases \\$0.10 for every additional mile.\
\\( \bigcirc \\) the fare increases \\$100 for every additional 0.1 mile.
Step1: Recall slope-intercept form
The line is $f = 0.1d + 100$, matching $y=mx+b$ where $m$=slope.
Step2: Interpret slope meaning
Slope $m=0.1$ means $\Delta f = 0.1\Delta d$. For $\Delta d=1$, $\Delta f=0.1$.
Step3: Match to options
This corresponds to a $0.10 fare increase per 1 mile.

Snap & solve any problem in the app
Get step-by-step solutions on Sovi AI
Photo-based solutions with guided steps
Explore more problems and detailed explanations
The fare increases $0.10 for every additional mile.