QUESTION IMAGE
Question
select the correct answer from each drop down menu.
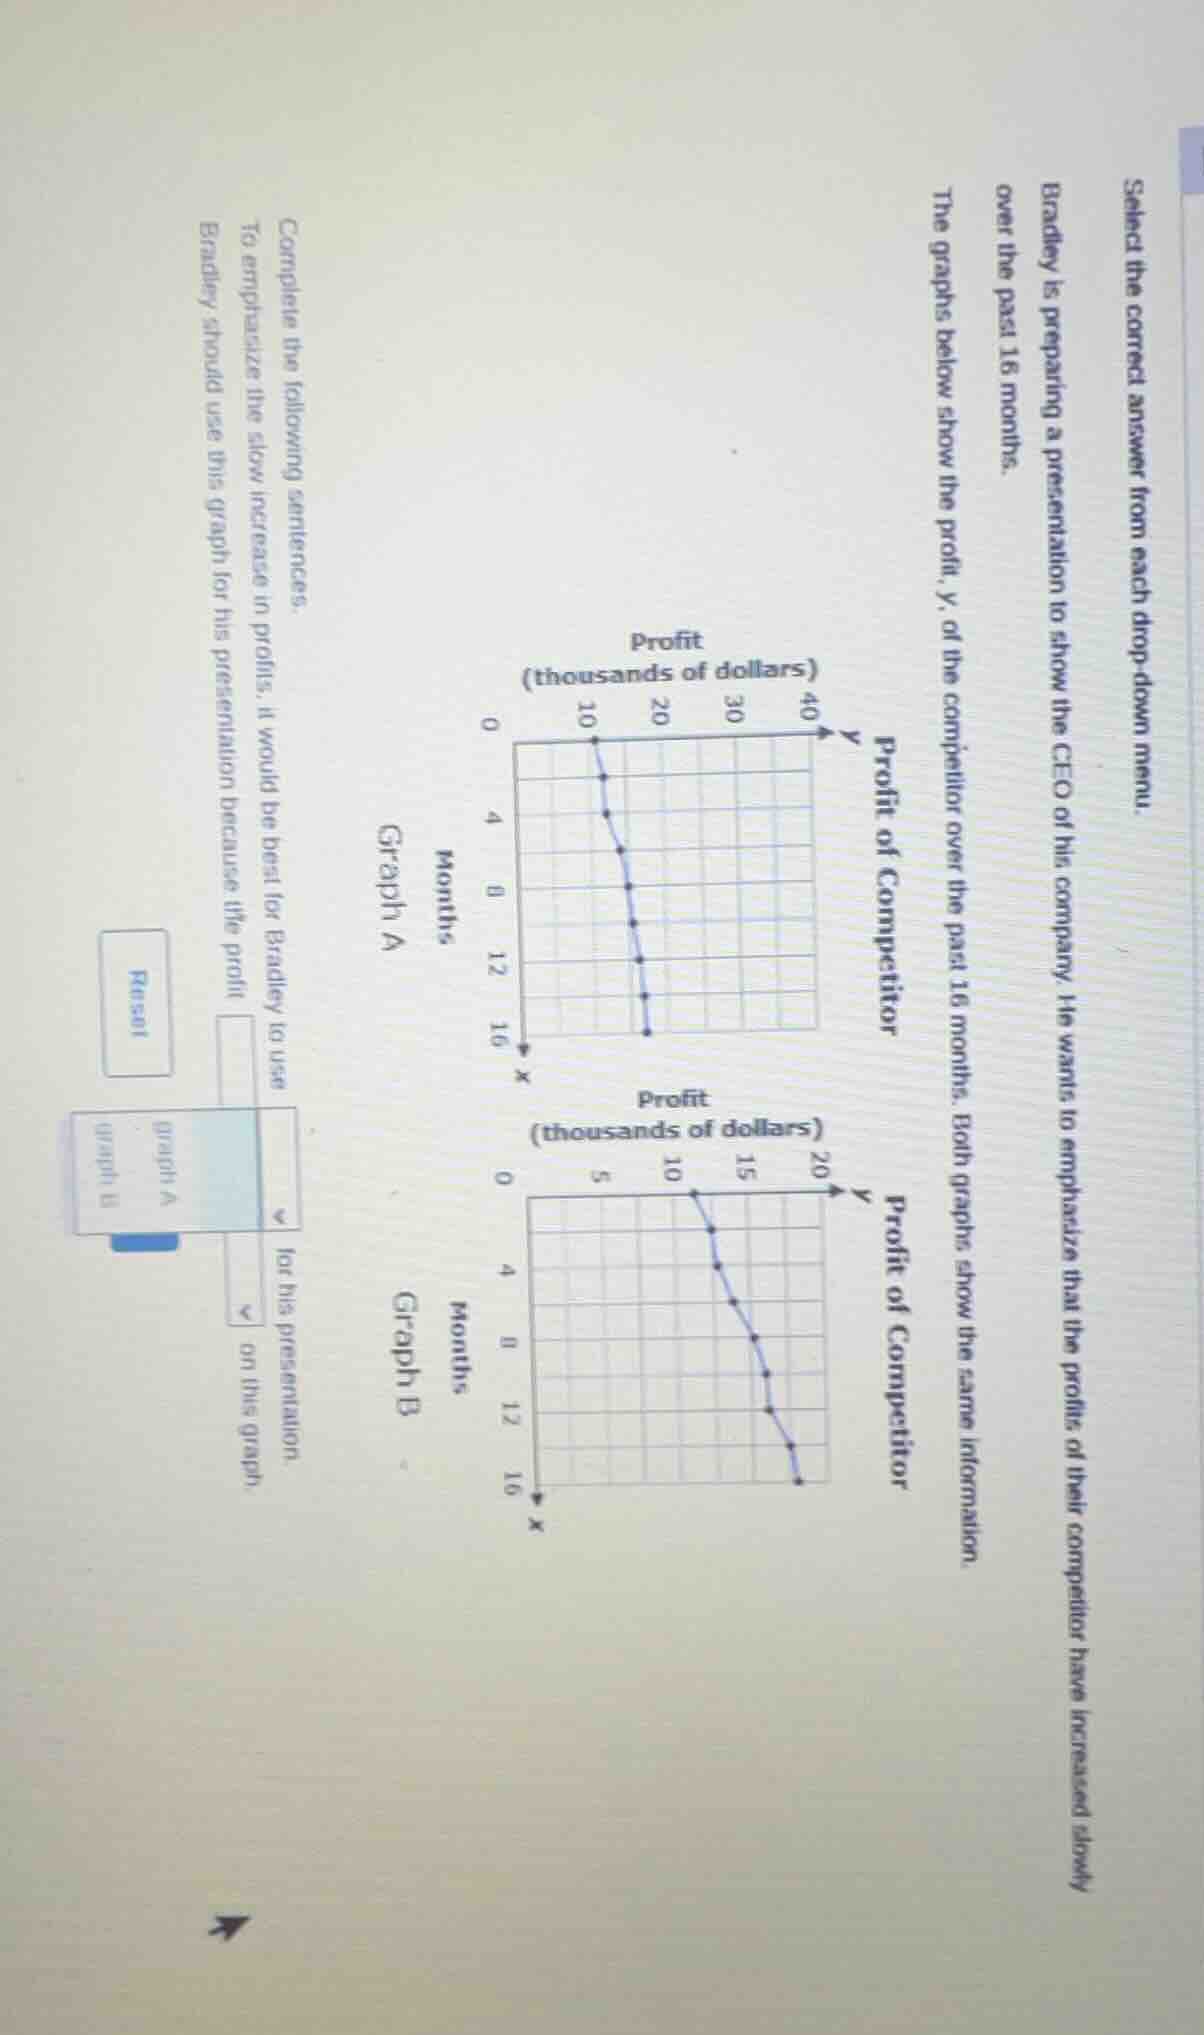
bradley is preparing a presentation to show the ceo of his company. he wants to emphasize that the profits of their competitor have increased slowly over the past 16 months.
the graphs below show the profit, y, of the competitor over the past 16 months. both graphs show the same information.
complete the following sentences.
to emphasize the slow increase in profits, it would be best for bradley to use
bradley should use this graph for his presentation because the profit
drop down menus with options like graph a, graph b and related descriptions
Step1: Analyze Graph Scales
Graph A has a y - axis (profit) scale from 0 to 40 (thousands of dollars), and Graph B has a y - axis scale from 0 to 20 (thousands of dollars). When we want to emphasize a slow increase, a graph with a larger y - axis range (like Graph A) makes the slope of the profit - time graph appear less steep (slower increase) compared to a graph with a smaller y - axis range (Graph B), where the same change in profit over time would look steeper.
Step2: Determine the Correct Graph
To emphasize the slow increase in profit, Bradley should use Graph A because the larger range on the y - axis of Graph A makes the profit increase seem slower (the line appears less steep) compared to Graph B.

Snap & solve any problem in the app
Get step-by-step solutions on Sovi AI
Photo-based solutions with guided steps
Explore more problems and detailed explanations
To emphasize the slow increase in profit, it would be best for Bradley to use Graph A for his presentation. Bradley should use this graph for his presentation because the profit increase appears slower on this graph.