QUESTION IMAGE
Question
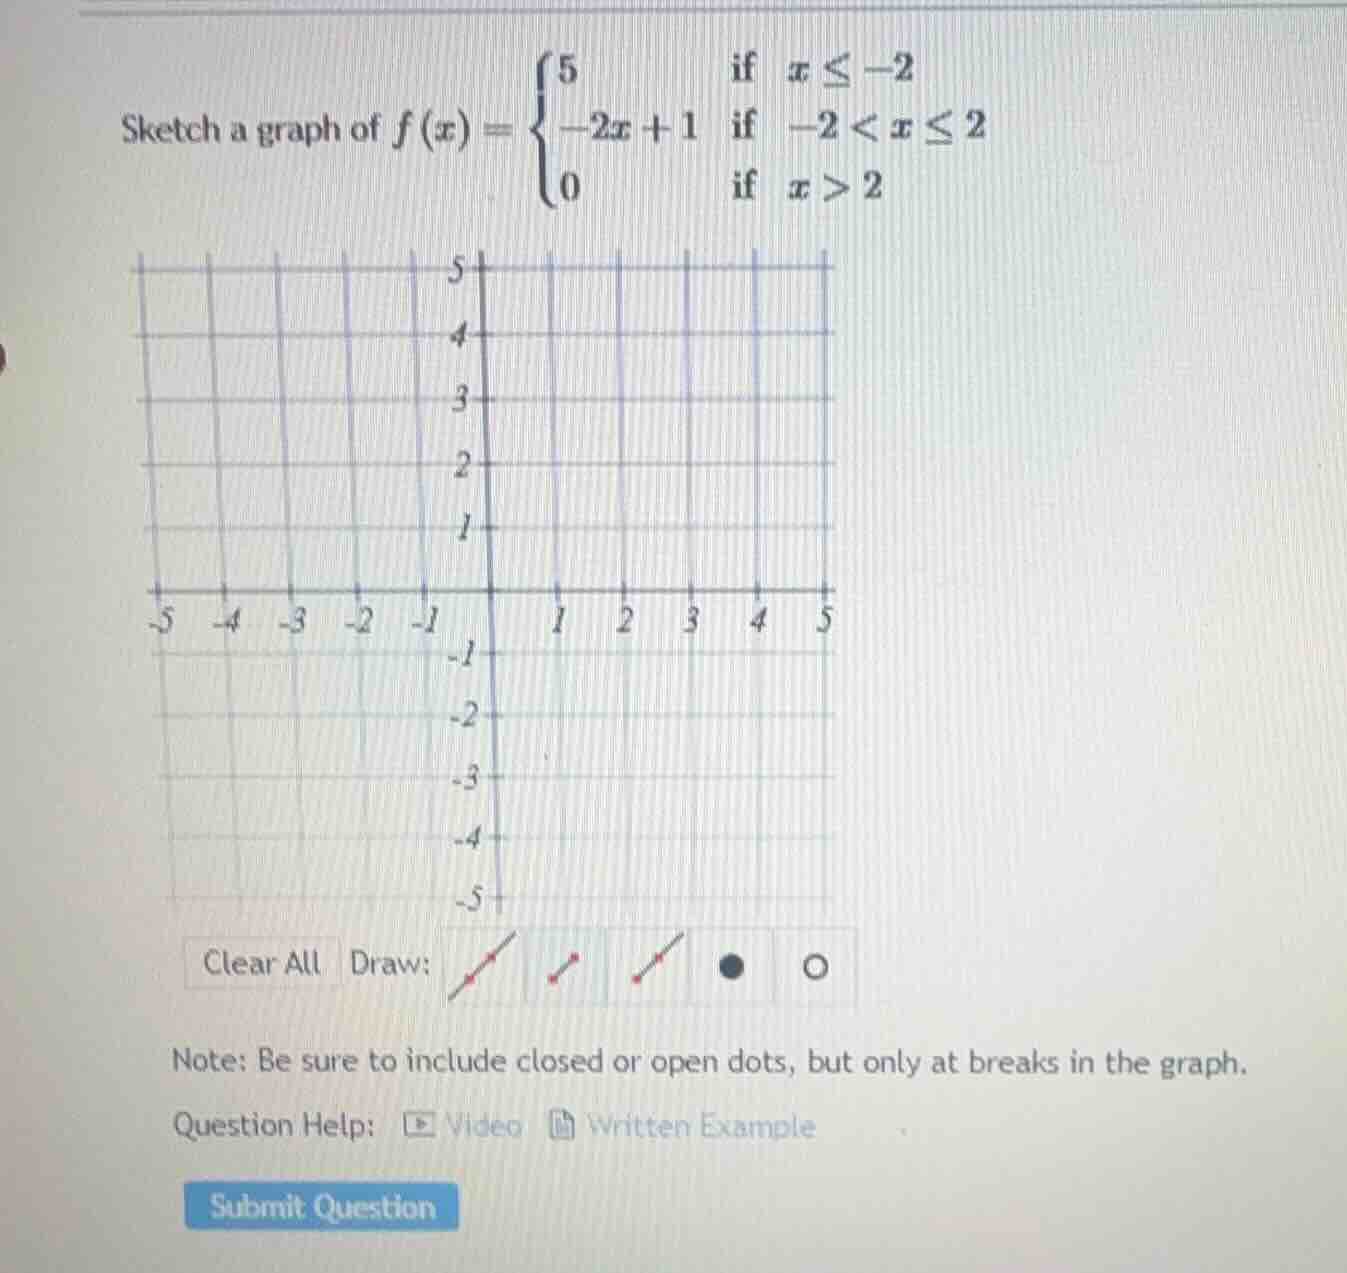
sketch a graph of $f(x) = \
$
graph grid and drawing tools shown
note: be sure to include closed or open dots, but only at breaks in the graph.
question help: video, written example
submit question
Step1: Analyze the first piece ($x \leq -2$)
The function is \( f(x) = 5 \) for \( x \leq -2 \). This is a horizontal line. At \( x = -2 \), we have a closed dot (since \( x \leq -2 \)) at \( ( - 2,5) \), and it extends to the left (as \( x \) decreases) with \( y = 5 \).
Step2: Analyze the second piece ($-2 < x \leq 2$)
The function is \( f(x)=-2x + 1 \) for \( -2 < x \leq 2 \). This is a linear function.
- At \( x=-2 \) (open dot, since \( -2 < x \)), \( f(-2)=-2(-2)+1 = 5 \) (open dot at \( (-2,5) \)).
- At \( x = 2 \) (closed dot, since \( x\leq2 \)), \( f(2)=-2(2)+1=-3 \) (closed dot at \( (2, - 3) \)).
We can also find another point, for example, when \( x = 0 \), \( f(0)=-2(0)+1 = 1 \), so the point \( (0,1) \) is on this line. We draw the line segment connecting these points (open at \( x=-2 \), closed at \( x = 2 \)).
Step3: Analyze the third piece ($x>2$)
The function is \( f(x) = 0 \) for \( x>2 \). This is a horizontal line. At \( x = 2 \), we have an open dot (since \( x>2 \)) at \( (2,0) \), and it extends to the right (as \( x \) increases) with \( y = 0 \).
To sketch the graph:
- Draw a horizontal line \( y = 5 \) from \( x=-\infty \) to \( x=-2 \), with a closed dot at \( (-2,5) \).
- Draw the line \( y=-2x + 1 \) from \( x=-2 \) (open dot at \( (-2,5) \)) to \( x = 2 \) (closed dot at \( (2,-3) \)).
- Draw a horizontal line \( y = 0 \) from \( x = 2 \) (open dot at \( (2,0) \)) to \( x=\infty \).
(Note: Since the question asks to sketch, the above steps describe how to plot the points and lines. If we were to describe the key points and segments:
- For \( x\leq - 2 \): Horizontal line \( y = 5 \), closed dot at \( (-2,5) \), leftward.
- For \( -2 < x\leq2 \): Line from open dot \( (-2,5) \) to closed dot \( (2,-3) \), passing through \( (0,1) \).
- For \( x>2 \): Horizontal line \( y = 0 \), open dot at \( (2,0) \), rightward.)

Snap & solve any problem in the app
Get step-by-step solutions on Sovi AI
Photo-based solutions with guided steps
Explore more problems and detailed explanations
The graph is composed of three parts: a horizontal line \( y = 5 \) for \( x\leq - 2 \) (closed dot at \( (-2,5) \)), a line segment \( y=-2x + 1 \) for \( -2 < x\leq2 \) (open at \( (-2,5) \), closed at \( (2,-3) \)), and a horizontal line \( y = 0 \) for \( x>2 \) (open dot at \( (2,0) \)). (The actual sketch would be drawn on the provided coordinate plane following these instructions.)