QUESTION IMAGE
Question
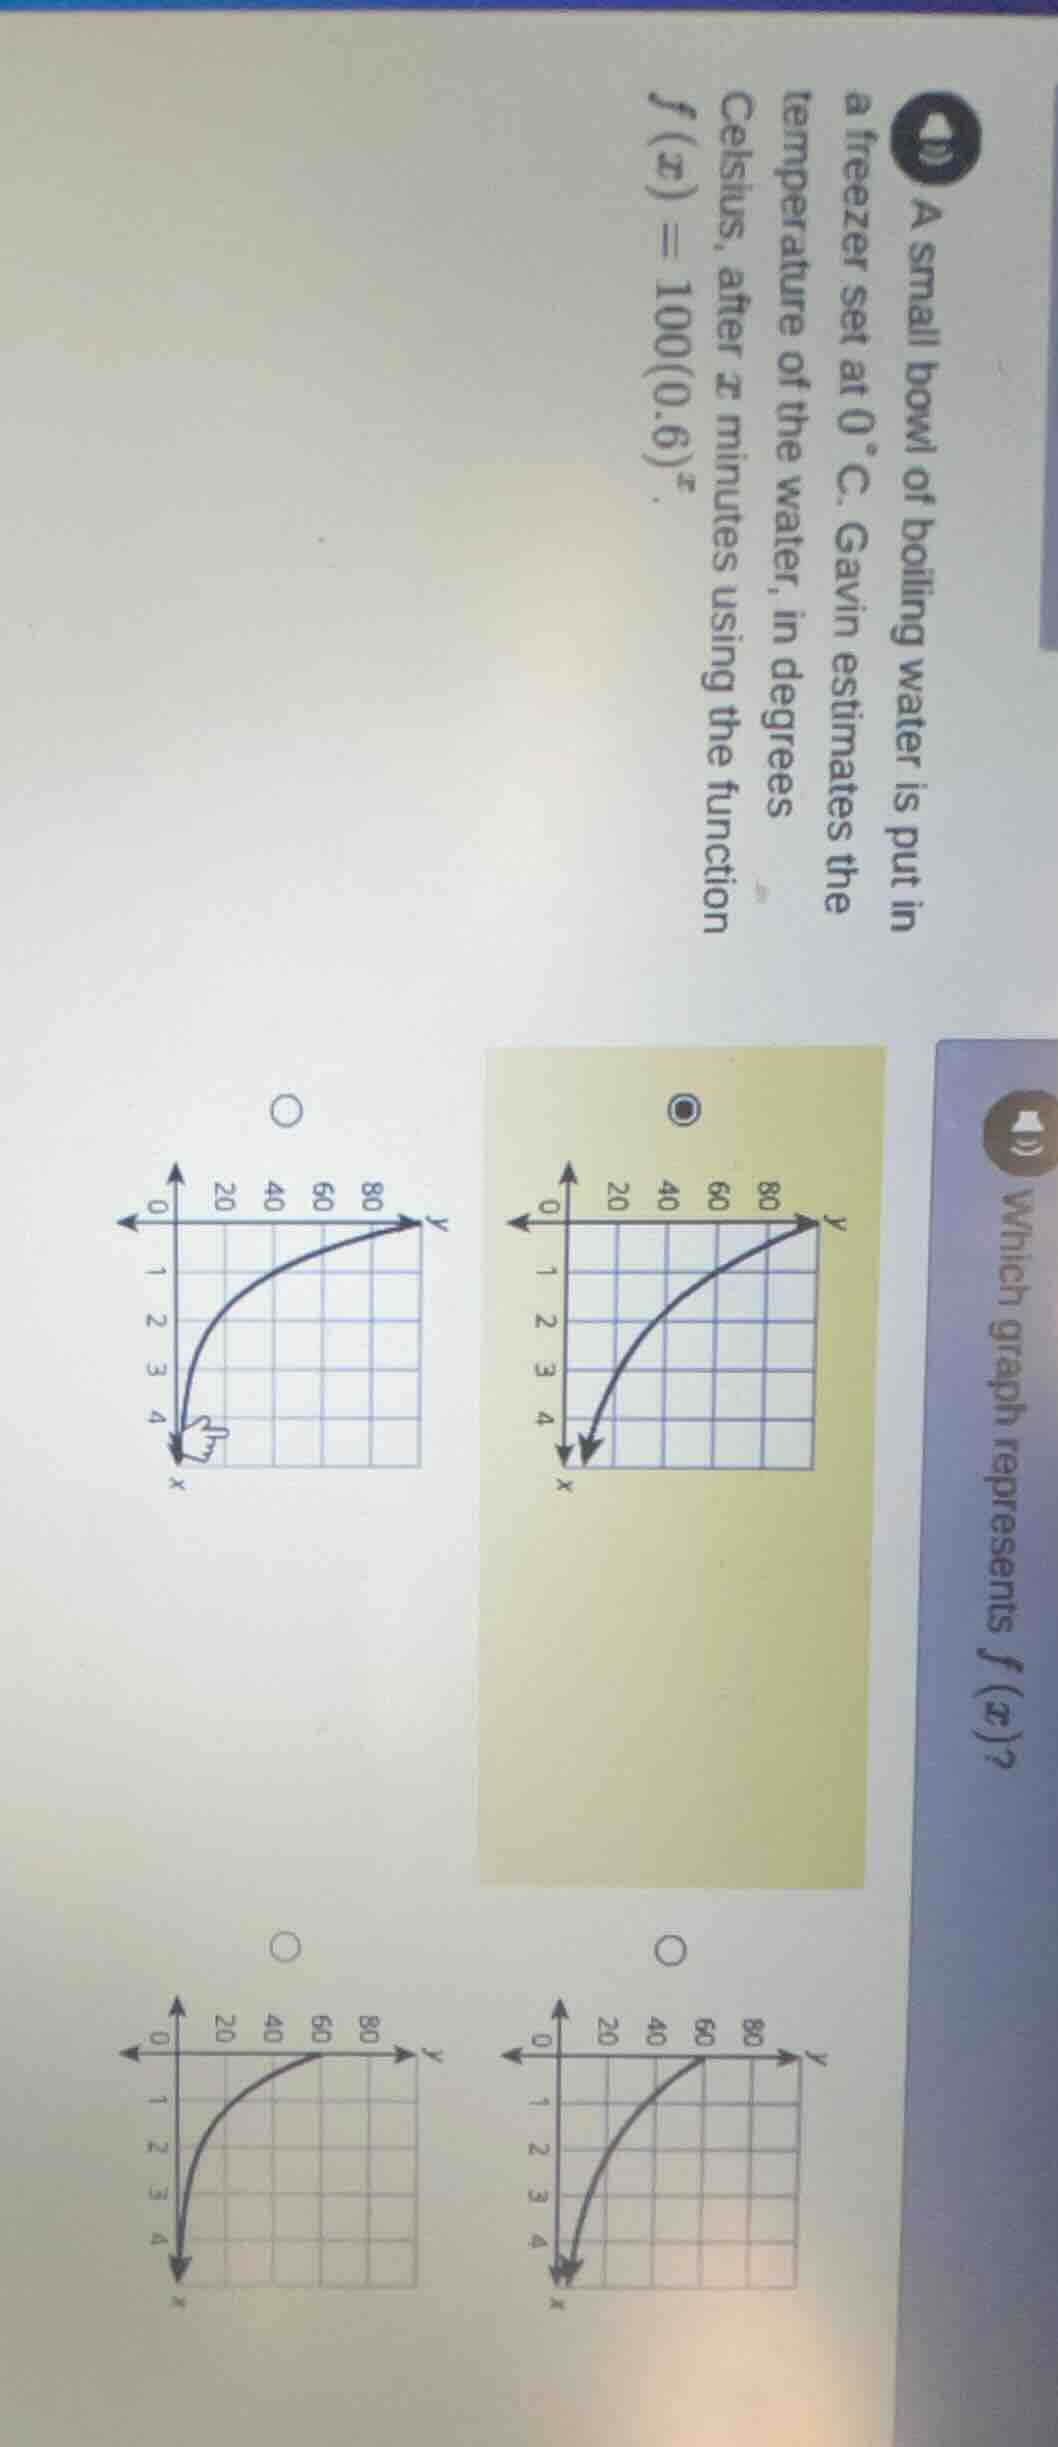
a small bowl of boiling water is put in a freezer set at 0 °c. gavin estimates the temperature of the water, in degrees celsius, after $x$ minutes using the function $f(x)=100(0.6)^x$.
which graph represents $f(x)$?

Snap & solve any problem in the app
Get step-by-step solutions on Sovi AI
Photo-based solutions with guided steps
Explore more problems and detailed explanations
The top-right graph (the one with the filled circle, starting at (0, 80) and curving down toward x=4, y approaching 0)