QUESTION IMAGE
Question
solving a problem with an exponential equation
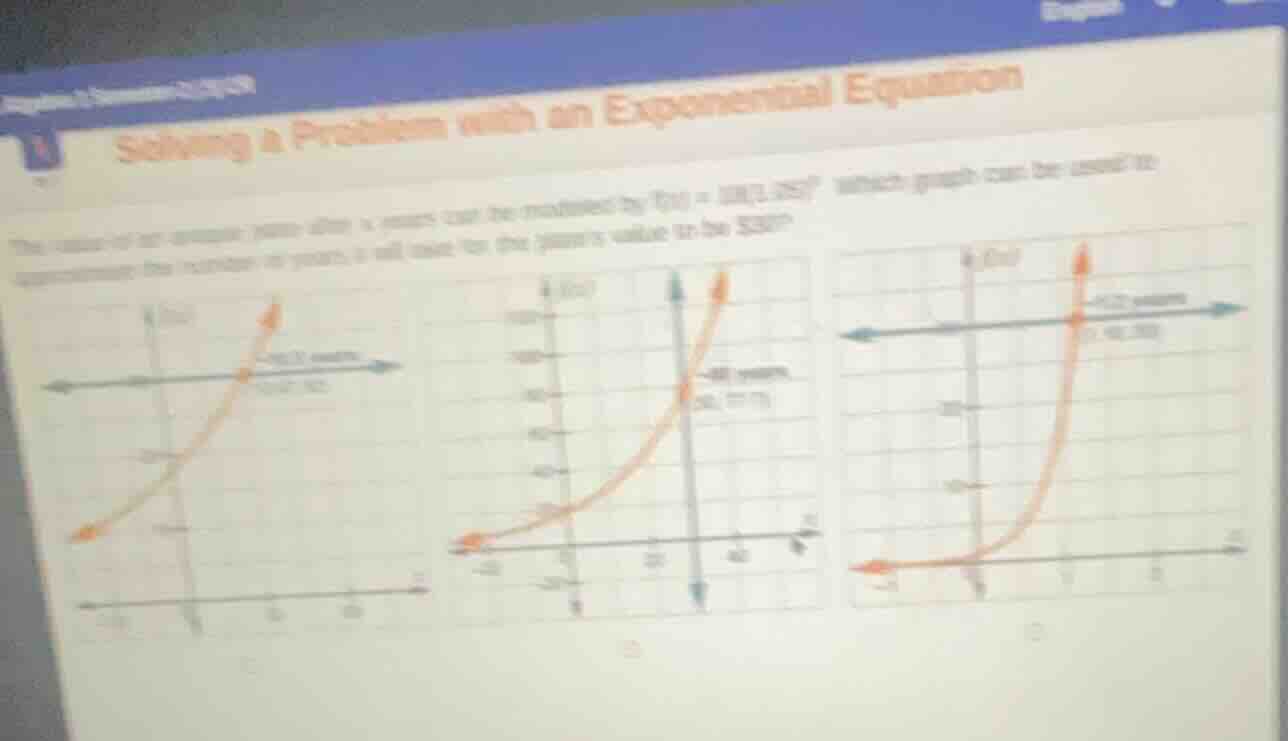
the value of an antique piano after x years can be modeled by ( f(x) = 180(1.05)^x ). which graph can be used to approximate the number of years x it will take for the piano’s value to be $320?
(three graphs are shown, each with an exponential curve and some annotations.)
Step1: Identify target value equation
Set $f(x)=80$, so:
$$10(1.25)^x = 80$$
Step2: Isolate exponential term
Divide both sides by 10:
$$(1.25)^x = 8$$
Step3: Analyze function behavior
The function $f(x)=10(1.25)^x$ is an exponential growth function (base $1.25>1$), so it increases as $x$ increases. When $x=0$, $f(0)=10$. We need to find $x$ where $f(x)=80$, so we look for a graph of an increasing exponential curve starting at $(0,10)$ that reaches $y=80$ at some positive $x$.
- The first graph: Shows an increasing exponential curve, passes through positive $x$ for $y=80$, matches the function's growth and starting value.
- The second graph: Includes negative $y$ axis values, which does not make sense for a monetary value (cannot be negative).
- The third graph: Starts near $x=-1$ with $f(x)\approx0$, but $f(0)=10$, so this does not match the initial value.

Snap & solve any problem in the app
Get step-by-step solutions on Sovi AI
Photo-based solutions with guided steps
Explore more problems and detailed explanations
The first leftmost graph is the correct one to approximate the number of years.