QUESTION IMAGE
Question
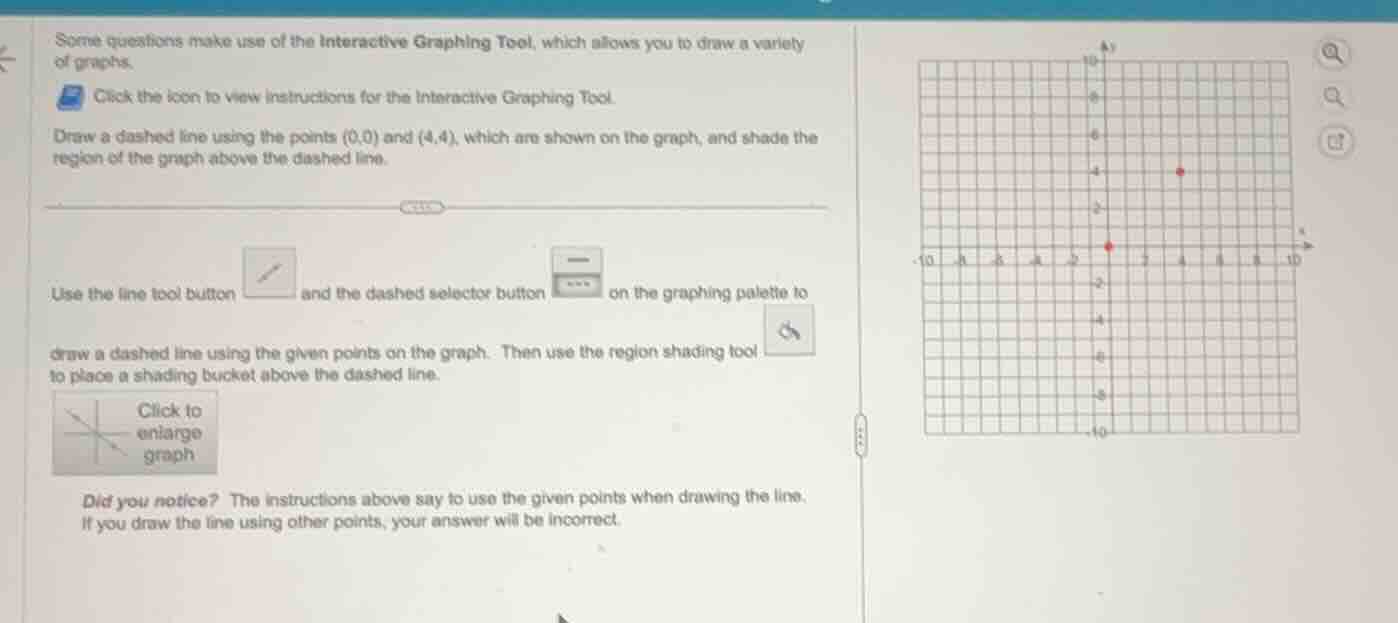
some questions make use of the interactive graphing tool, which allows you to draw a variety of graphs. click the icon to view instructions for the interactive graphing tool. draw a dashed line using the points (0,0) and (4,4), which are shown on the graph, and shade the region of the graph above the dashed line. use the line tool button and the dashed selector button on the graphing palette to draw a dashed line using the given points on the graph. then use the region shading tool to place a shading bucket above the dashed line. click to enlarge graph did you notice? the instructions above say to use the given points when drawing the line. if you draw the line using other points, your answer will be incorrect.
Step1: Find line equation
First, calculate the slope: $m=\frac{4-0}{4-0}=1$. Using point $(0,0)$, the line equation is $y=x$.
Step2: Draw dashed line
Plot points $(0,0)$ and $(4,4)$, then connect them with a dashed line representing $y=x$.
Step3: Shade upper region
Shade all areas on the graph where $y > x$ (above the dashed line).

Snap & solve any problem in the app
Get step-by-step solutions on Sovi AI
Photo-based solutions with guided steps
Explore more problems and detailed explanations
A dashed line connecting (0,0) and (4,4) (representing $y=x$) is drawn, and the entire region above this dashed line is shaded.