QUESTION IMAGE
Question
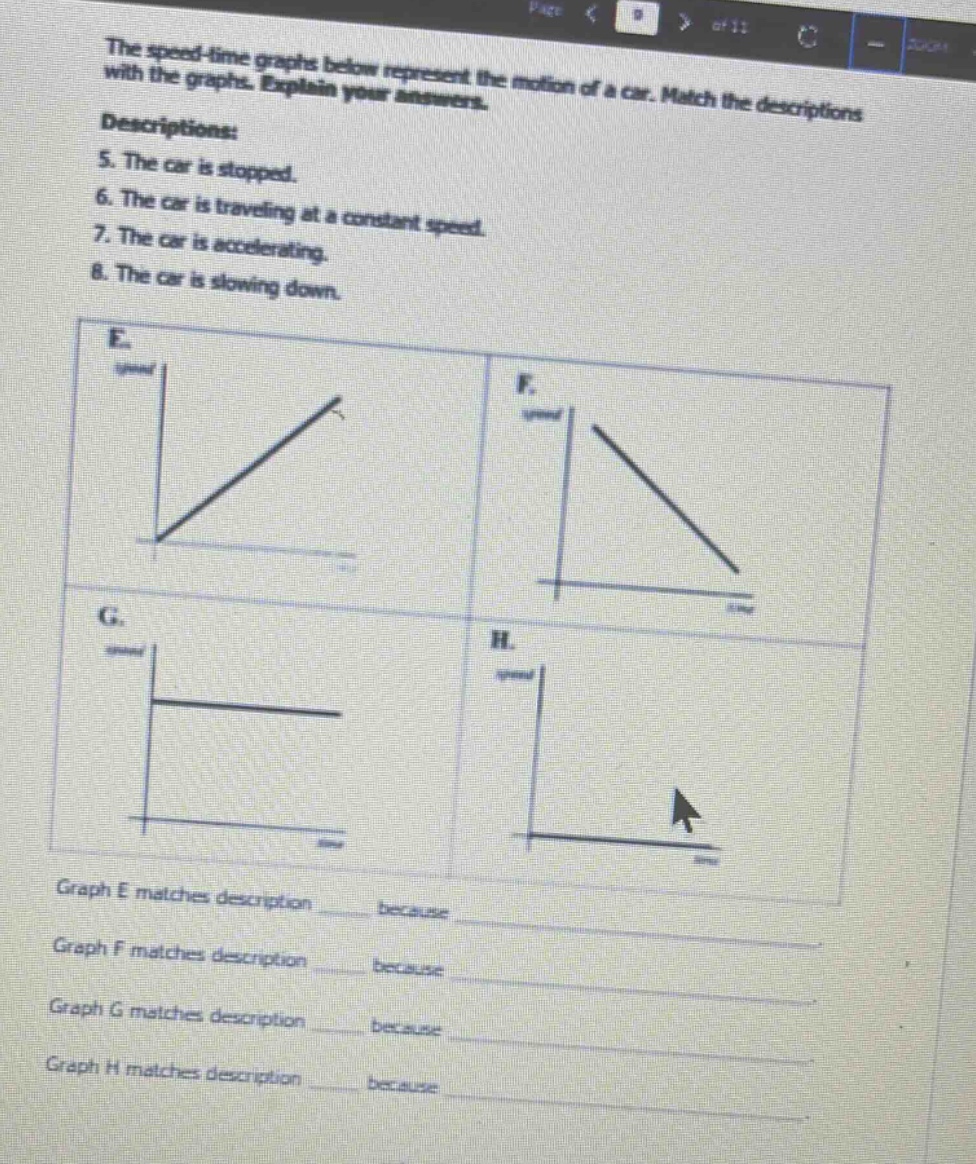
the speed - time graphs below represent the motion of a car. match the descriptions with the graphs. explain your answers.
descriptions:
- the car is stopped.
- the car is traveling at a constant speed.
- the car is accelerating.
- the car is slowing down.
graph e matches description __ because __
graph f matches description __ because __
graph g matches description __ because __
graph h matches description __ because __
Graph E:
Step 1: Analyze Graph E
Graph E is a speed - time graph where speed increases linearly with time. In a speed - time graph, acceleration is the rate of change of speed with respect to time ($a=\frac{\Delta v}{\Delta t}$). When speed increases with time, the car is accelerating.
Step 2: Match with Description
The description "The car is accelerating" (description 7) matches Graph E because the speed of the car (on the y - axis) is increasing as time (on the x - axis) passes, which means the rate of change of speed (acceleration) is positive.
Graph F:
Step 1: Analyze Graph F
Graph F is a speed - time graph where speed decreases linearly with time. The rate of change of speed ($a = \frac{\Delta v}{\Delta t}$) is negative here, which means the car is slowing down.
Step 2: Match with Description
The description "The car is slowing down" (description 8) matches Graph F because the speed of the car (on the y - axis) is decreasing as time (on the x - axis) passes, indicating a decrease in speed.
Graph G:
Step 1: Analyze Graph G
Graph G is a speed - time graph where the speed of the car remains constant as time passes. In a speed - time graph, a constant speed means that the rate of change of speed ($a=\frac{\Delta v}{\Delta t}$) is zero (since $\Delta v = 0$).
Step 2: Match with Description
The description "The car is traveling at a constant speed" (description 6) matches Graph G because the speed of the car (on the y - axis) does not change as time (on the x - axis) changes.
Graph H:

Snap & solve any problem in the app
Get step-by-step solutions on Sovi AI
Photo-based solutions with guided steps
Explore more problems and detailed explanations
s:
- Graph E matches description 7 because the speed of the car increases with time (indicating acceleration).
- Graph F matches description 8 because the speed of the car decreases with time (indicating deceleration or slowing down).
- Graph G matches description 6 because the speed of the car remains constant with time.
- Graph H matches description 5 because the speed of the car is zero (the car is not moving, so it is stopped).