QUESTION IMAGE
Question
svlc algebra 1a - standard (15260)
introduction to compound inequalities
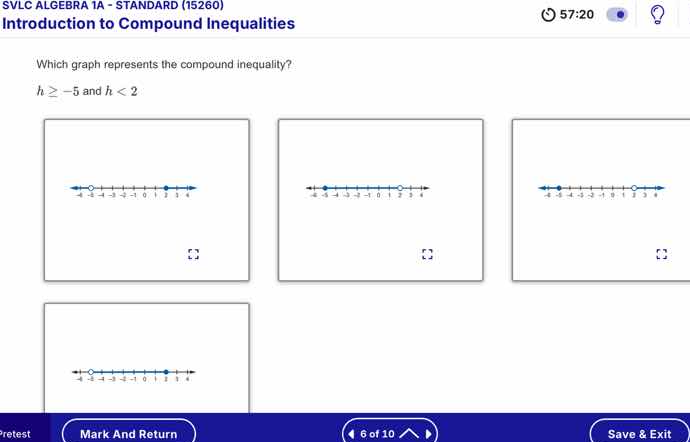
which graph represents the compound inequality?
$h \geq -5$ and $h < 2$
(there are four graphs shown as images, with number lines from -4 to 4 or -5 to 4, some with open or closed circles and blue lines indicating the solution set.)
pretest
mark and return
6 of 10
save & exit
Step1: Analyze \( h \geq -5 \)
For \( h \geq -5 \), the graph should have a closed circle at \(-5\) (since the inequality is "greater than or equal to") and an arrow pointing to the right (towards larger numbers).
Step2: Analyze \( h < 2 \)
For \( h < 2 \), the graph should have an open circle at \( 2 \) (since the inequality is "less than", not "less than or equal to") and an arrow pointing to the left (towards smaller numbers).
Step3: Combine the two inequalities
The compound inequality \( h \geq -5 \) and \( h < 2 \) represents all numbers from \(-5\) (inclusive) up to \( 2 \) (exclusive). So we look for a graph with a closed circle at \(-5\), an open circle at \( 2 \), and a line segment connecting them (indicating the numbers between \(-5\) and \( 2 \) that satisfy both inequalities).
Looking at the given graphs, the second graph (middle one) has a closed circle at \(-5\), an open circle at \( 2 \), and a line between them, which matches our analysis.

Snap & solve any problem in the app
Get step-by-step solutions on Sovi AI
Photo-based solutions with guided steps
Explore more problems and detailed explanations
The middle graph (with closed circle at -5, open circle at 2, and line segment between them)