QUESTION IMAGE
Question
svlc algebra 1a - standard (15260)
modeling with two - variable linear inequalities
representing a scenario with a two - variable linear inequality
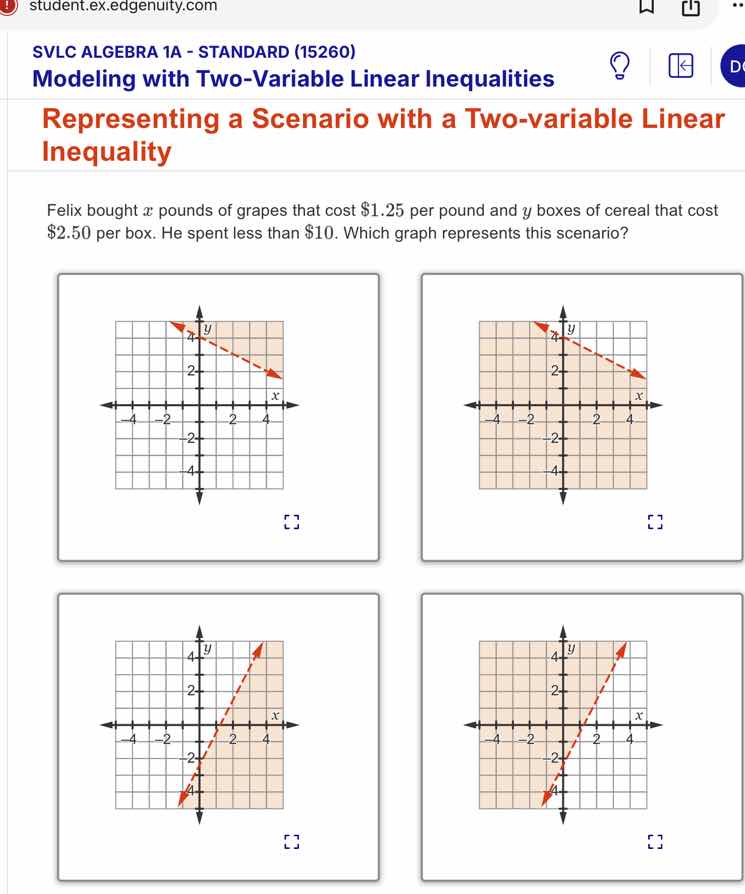
felix bought ( x ) pounds of grapes that cost $1.25 per pound and ( y ) boxes of cereal that cost $2.50 per box. he spent less than $10. which graph represents this scenario?
Step1: Formulate the inequality
The cost of grapes is \(1.25x\) dollars (since \(x\) pounds at \(\$1.25\) per pound) and the cost of cereal is \(2.50y\) dollars (since \(y\) boxes at \(\$2.50\) per box). He spent less than \(\$10\), so the inequality is \(1.25x + 2.50y < 10\).
Step2: Rewrite in slope - intercept form (\(y = mx + b\))
First, isolate \(y\):
\[
\]
The boundary line is \(y=-0.5x + 4\) (dashed line because the inequality is strict, \(<\) not \(\leq\)). The slope is \(- 0.5\) (negative, so the line should be decreasing) and the \(y\) - intercept is \(4\).
Step3: Determine the region to shade
We test the origin \((0,0)\) in the inequality \(1.25x + 2.50y < 10\). Substituting \(x = 0\) and \(y = 0\), we get \(0+0<10\), which is true. So we shade the region that includes the origin.
Now, let's analyze the graphs:
- The line \(y=-0.5x + 4\) has a negative slope and \(y\) - intercept of \(4\). So we can eliminate the graphs with positive - sloped lines (the bottom two graphs).
- Between the top two graphs, the one that shades the region including the origin (since \((0,0)\) satisfies the inequality) is the first top graph (the one with the white region not including the origin? Wait, no. Wait, the inequality is \(y < - 0.5x+4\). So the region below the line. Let's check the origin \((0,0)\): \(0 < - 0.5(0)+4=4\), which is true. So the region below the line (dashed line) and including the origin. The first top graph: the line is dashed (correct for \(<\)), and the shaded region? Wait, maybe I mixed up. Wait, the first top graph has a dashed line and the shaded region is above or below? Wait, no, let's re - express the inequality. The line \(y=-0.5x + 4\): when \(x = 0\), \(y = 4\); when \(y = 0\), \(x = 8\). Wait, maybe the graphs are scaled. Wait, in the given graphs, the \(x\) and \(y\) axes go from \(- 4\) to \(4\). Let's find two points on the line \(y=-0.5x + 4\) within the graph's range. When \(x = 0\), \(y = 4\); when \(x = 8\), \(y = 0\), but in the graph, \(x\) and \(y\) go up to \(4\). So when \(x = 4\), \(y=-0.5(4)+4=-2 + 4 = 2\). So the line passes through \((0,4)\) and \((4,2)\) (dashed line). The inequality is \(y < - 0.5x + 4\), so we shade below the line. The origin \((0,0)\) is below the line (since \(0<4\) and when \(x = 0\), the line is at \(y = 4\)), so the region including the origin (the first top graph: the white area is outside, the shaded area? Wait, maybe the first top graph has the shaded region below the line (including the origin) and the second top graph has the shaded region above. Wait, no, let's check the two top graphs. The first top graph: the line is dashed, going from \((0,4)\) to \((4,2)\), and the shaded region is the area that includes the origin (the area below the line). The second top graph has the shaded region above the line (which would not include the origin, since \((0,0)\) is below the line). So the correct graph is the first top graph (the one with the dashed line from \((0,4)\) to \((4,2)\) and the shaded region below the line, including the origin).

Snap & solve any problem in the app
Get step-by-step solutions on Sovi AI
Photo-based solutions with guided steps
Explore more problems and detailed explanations
The first top graph (the one with the dashed line, negative slope, \(y\) - intercept at \(4\), and the shaded region including the origin). (Assuming the first top graph is the one on the top - left, with the dashed line and the white area outside the shaded region? Wait, maybe the user's graphs: the first top graph has a dashed line and the shaded region is the area that is below the line (including \((0,0)\)). So the answer is the top - left graph (the first one in the top row).