QUESTION IMAGE
Question
svlc algebra 1a - standard (15260)
modeling with two - variable linear inequalities
identifying the graph of an inequality
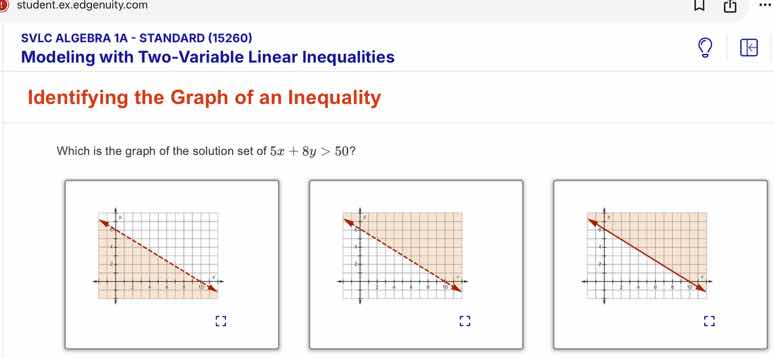
which is the graph of the solution set of (5x + 8y>50)?
Step 1: Rewrite the inequality in slope - intercept form
We start with the inequality \(5x + 8y>50\). We want to solve for \(y\) to get it in the form \(y = mx + b\) (slope - intercept form).
Subtract \(5x\) from both sides: \(8y>- 5x + 50\).
Then divide each term by \(8\): \(y>-\frac{5}{8}x+\frac{50}{8}=-\frac{5}{8}x+\frac{25}{4}\).
Step 2: Analyze the boundary line
The boundary line of the inequality \(y>-\frac{5}{8}x+\frac{25}{4}\) is the line \(y =-\frac{5}{8}x+\frac{25}{4}\). Since the inequality is \(y>\) (and not \(y\geq\)), the boundary line should be a dashed line. This is because the points on the line \(y =-\frac{5}{8}x+\frac{25}{4}\) do not satisfy the inequality \(y>-\frac{5}{8}x+\frac{25}{4}\).
Step 3: Analyze the region of the solution
To determine which side of the line to shade, we can use a test point. A common test point is \((0,0)\) (as long as it is not on the boundary line).
Substitute \(x = 0\) and \(y = 0\) into the original inequality \(5x+8y>50\): \(5(0)+8(0)=0\), and \(0>50\) is false. So we do not shade the region that contains the origin \((0,0)\). We shade the region above the line \(y =-\frac{5}{8}x+\frac{25}{4}\) (since the inequality is \(y>\)).
Now, looking at the three graphs:
- The first graph: Dashed line, but we need to check the shaded region. If we test \((0,0)\) in the inequality \(5x + 8y>50\), \(0>50\) is false, so the shaded region should not include \((0,0)\). If the first graph's shaded region includes \((0,0)\), it is wrong.
- The second graph: Dashed line (correct for \(>\)) and the shaded region is above the line (and does not include \((0,0)\) since when we test \((0,0)\) it does not satisfy the inequality, so the shaded region is on the side that does not include \((0,0)\) which is the upper side of the line).
- The third graph: Solid line (incorrect, since the inequality is \(>\) not \(\geq\)), so we can eliminate the third graph.

Snap & solve any problem in the app
Get step-by-step solutions on Sovi AI
Photo-based solutions with guided steps
Explore more problems and detailed explanations
The graph with the dashed boundary line \(y =-\frac{5}{8}x+\frac{25}{4}\) and the region above the line (the second graph among the three given) is the graph of the solution set of \(5x + 8y>50\).