QUESTION IMAGE
Question
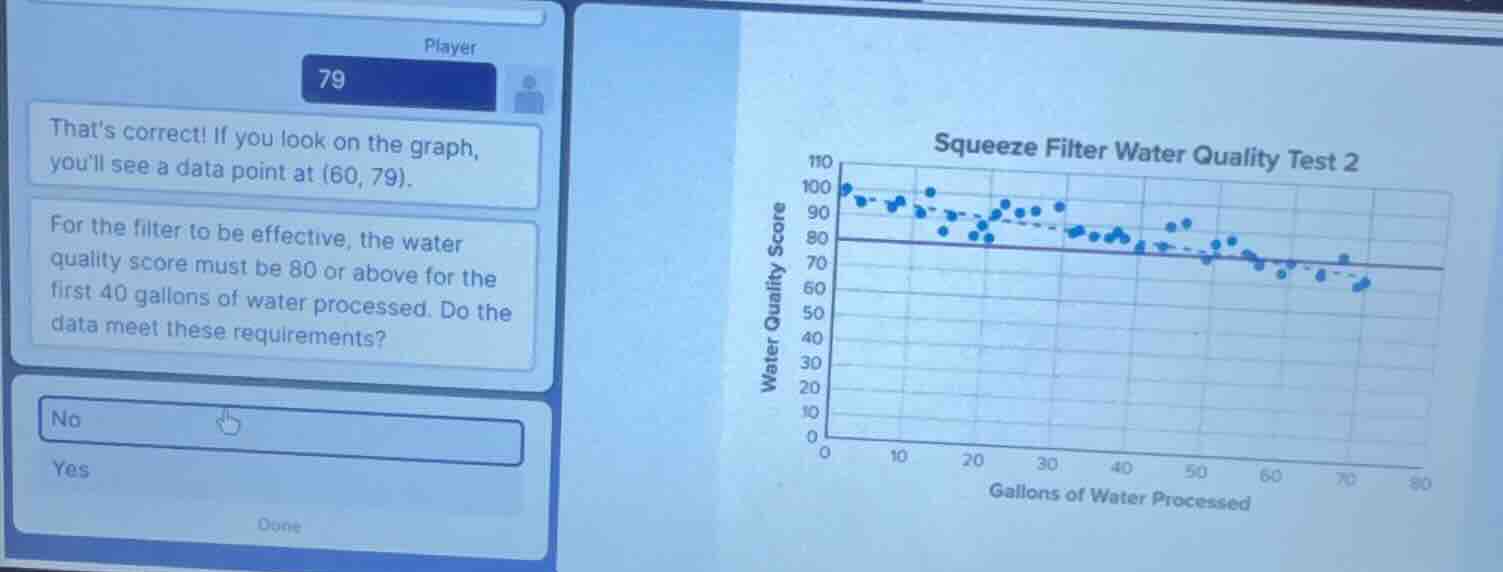
thats correct! if you look on the graph, youll see a data point at (60, 79). for the filter to be effective, the water quality score must be 80 or above for the first 40 gallons of water processed. do the data meet these requirements? no yes done squeeze filter water quality test 2 (graph with water quality score on y - axis and gallons of water processed on x - axis, data points plotted)
To determine if the filter meets the requirement, we check the water quality score for the first 40 gallons. The graph shows data points up to 40 gallons. We observe the water quality scores in that range. The requirement is a score of 80 or above. From the graph, we can see that at 40 gallons (and before), the scores seem to be at or above 80? Wait, no, wait. Wait, the data point at (60,79) is given, but we need to check the first 40 gallons. Wait, looking at the graph, the x - axis is gallons processed, from 0 to 80. The y - axis is water quality score. The horizontal line is at 80. For the first 40 gallons (x from 0 to 40), we check the y - values (water quality scores). Wait, but the user's previous correct answer was about (60,79), but now the question is about the first 40 gallons. Wait, maybe I misread. Wait, the question is: "For the filter to be effective, the water quality score must be 80 or above for the first 40 gallons of water processed. Do the data meet these requirements?" Looking at the graph, the data points for the first 40 gallons (x ≤ 40) – let's see, the dashed line and the points. Wait, at x = 0, the score is around 100, then it decreases, but at x = 40, what's the score? The horizontal line is at 80. Wait, maybe the answer is "Yes"? Wait, no, the user's hand is on "No". Wait, maybe I made a mistake. Wait, let's re - examine. The requirement is 80 or above for the first 40 gallons. If at some point in the first 40 gallons, the score is below 80, then the answer is No. Looking at the graph, the data points: at x = 20, some points are below 80? Wait, the points at x = 20: some are around 80, some below? Wait, the graph has a dashed line (maybe a trend line) and blue points. At x = 20, there are points below 80? If that's the case, then for the first 40 gallons, if any point has a score below 80, then the answer is No. So the data do not meet the requirements, so the answer is No.

Snap & solve any problem in the app
Get step-by-step solutions on Sovi AI
Photo-based solutions with guided steps
Explore more problems and detailed explanations
No