QUESTION IMAGE
Question
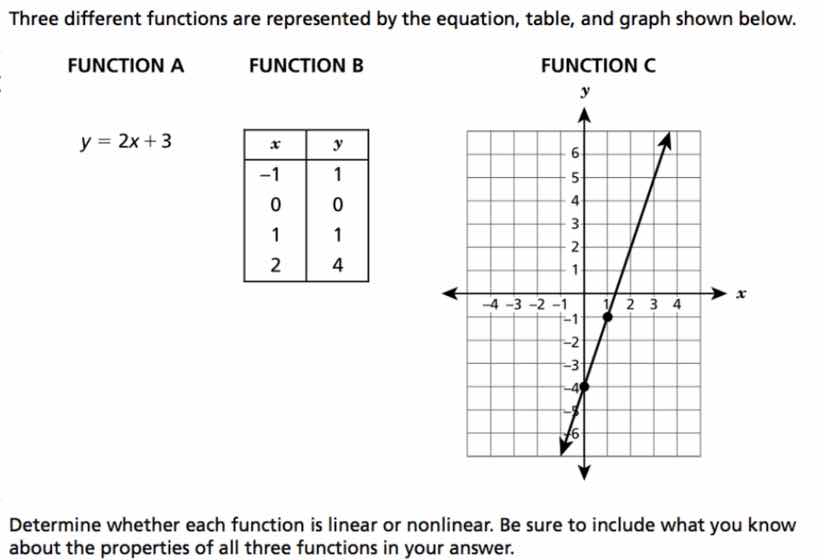
three different functions are represented by the equation, table, and graph shown below. function a: ( y = 2x + 3 ); function b: a table with x values -1, 0, 1, 2 and corresponding y values 1, 0, 1, 4; function c: a graph in a coordinate plane. determine whether each function is linear or nonlinear. be sure to include what you know about the properties of all three functions in your answer.
Brief Explanations
- Function A: It follows the standard linear form $y=mx+b$ (where $m=2$, $b=3$), which defines a linear function with a constant slope.
- Function B: Calculate the rate of change (slope) between points:
- Between $(-1,1)$ and $(0,0)$: $\frac{0-1}{0-(-1)}=-1$
- Between $(0,0)$ and $(1,1)$: $\frac{1-0}{1-0}=1$
The slope is not constant, so it is nonlinear.
- Function C: The graph is a straight line, which is the defining visual property of a linear function; it has a constant, unchanging slope.

Snap & solve any problem in the app
Get step-by-step solutions on Sovi AI
Photo-based solutions with guided steps
Explore more problems and detailed explanations
- Function A: Linear (follows $y=mx+b$ form with constant slope)
- Function B: Nonlinear (slope between points is not constant)
- Function C: Linear (graph is a straight line with constant slope)