QUESTION IMAGE
Question
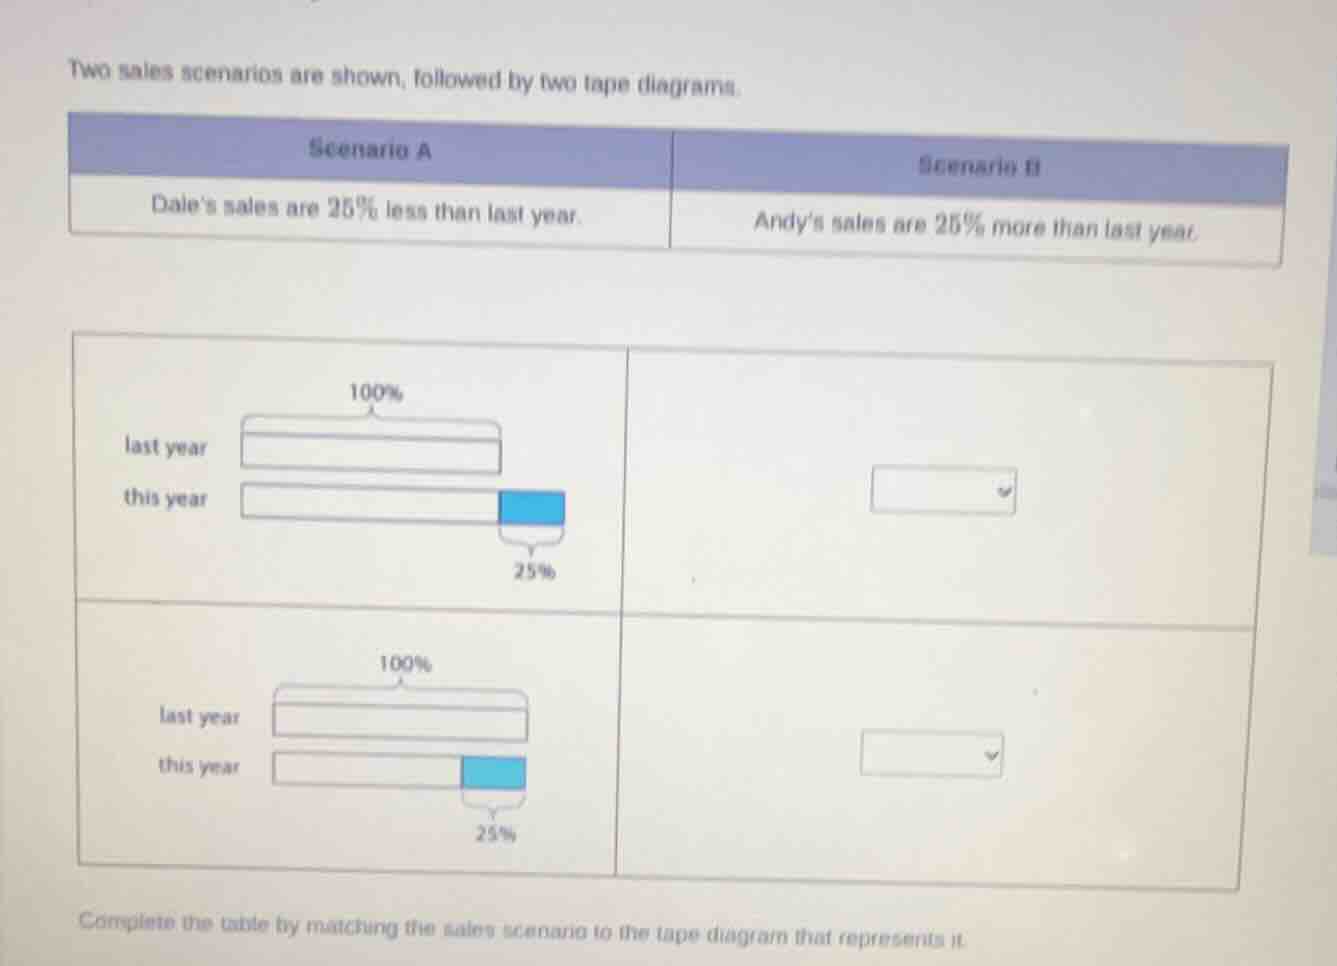
two sales scenarios are shown, followed by two tape diagrams.
scenario a: dales sales are 25% less than last year.
scenario b: andys sales are 25% more than last year.
two tape diagrams are shown, one with last year as 100% and this year longer with a 25% segment, the other with last year as 100% and this year shorter with a 25% segment
complete the table by matching the sales scenario to the tape diagram that represents it.
Step1: Analyze Scenario A (Dale's sales)
Dale's sales are 25% less than last year. So, this year's sales should be shorter than last year's (since it's a decrease). The second tape diagram (bottom left) has this year's bar shorter than last year's (with the 25% decrease shown as the missing part), so this diagram represents Scenario A.
Step2: Analyze Scenario B (Andy's sales)
Andy's sales are 25% more than last year. So, this year's sales should be longer than last year's (since it's an increase). The first tape diagram (top left) has this year's bar longer than last year's (with the 25% increase shown as the extra part), so this diagram represents Scenario B.

Snap & solve any problem in the app
Get step-by-step solutions on Sovi AI
Photo-based solutions with guided steps
Explore more problems and detailed explanations
- Scenario A (Dale's sales are 25% less than last year) matches the bottom - left tape diagram (where this year's bar is shorter than last year's with a 25% segment).
- Scenario B (Andy's sales are 25% more than last year) matches the top - left tape diagram (where this year's bar is longer than last year's with a 25% segment).