QUESTION IMAGE
Question
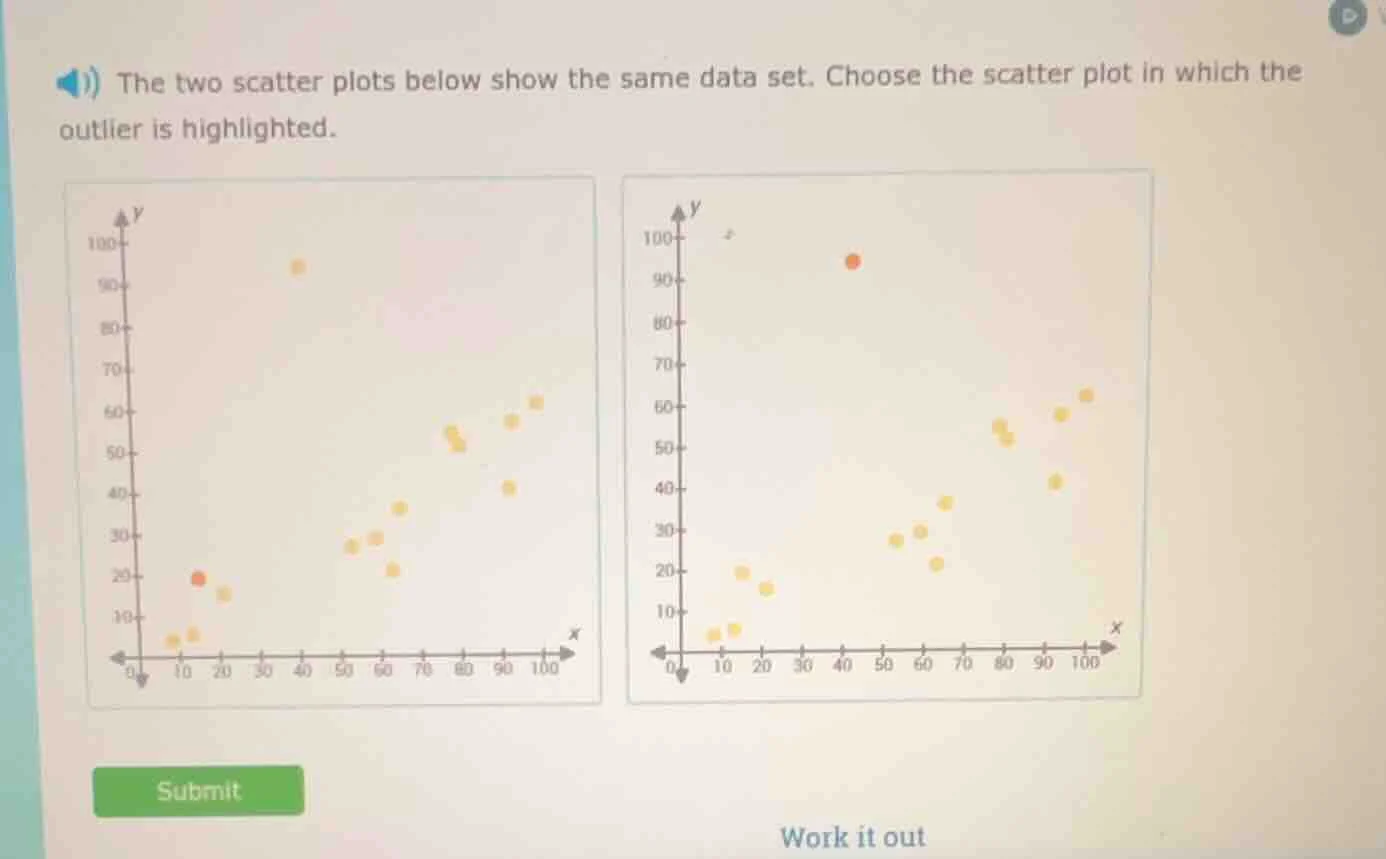
the two scatter plots below show the same data set. choose the scatter plot in which the outlier is highlighted.
Brief Explanations
An outlier is a data point that lies far outside the general cluster of other data points. In the left plot, the highlighted point is close to the lower group of points. In the right plot, the highlighted point is far above the main cluster of data points, making it the true outlier of the dataset.

Snap & solve any problem in the app
Get step-by-step solutions on Sovi AI
Photo-based solutions with guided steps
Explore more problems and detailed explanations
The right scatter plot (with the orange point near y=95, x=50 highlighted)