QUESTION IMAGE
Question
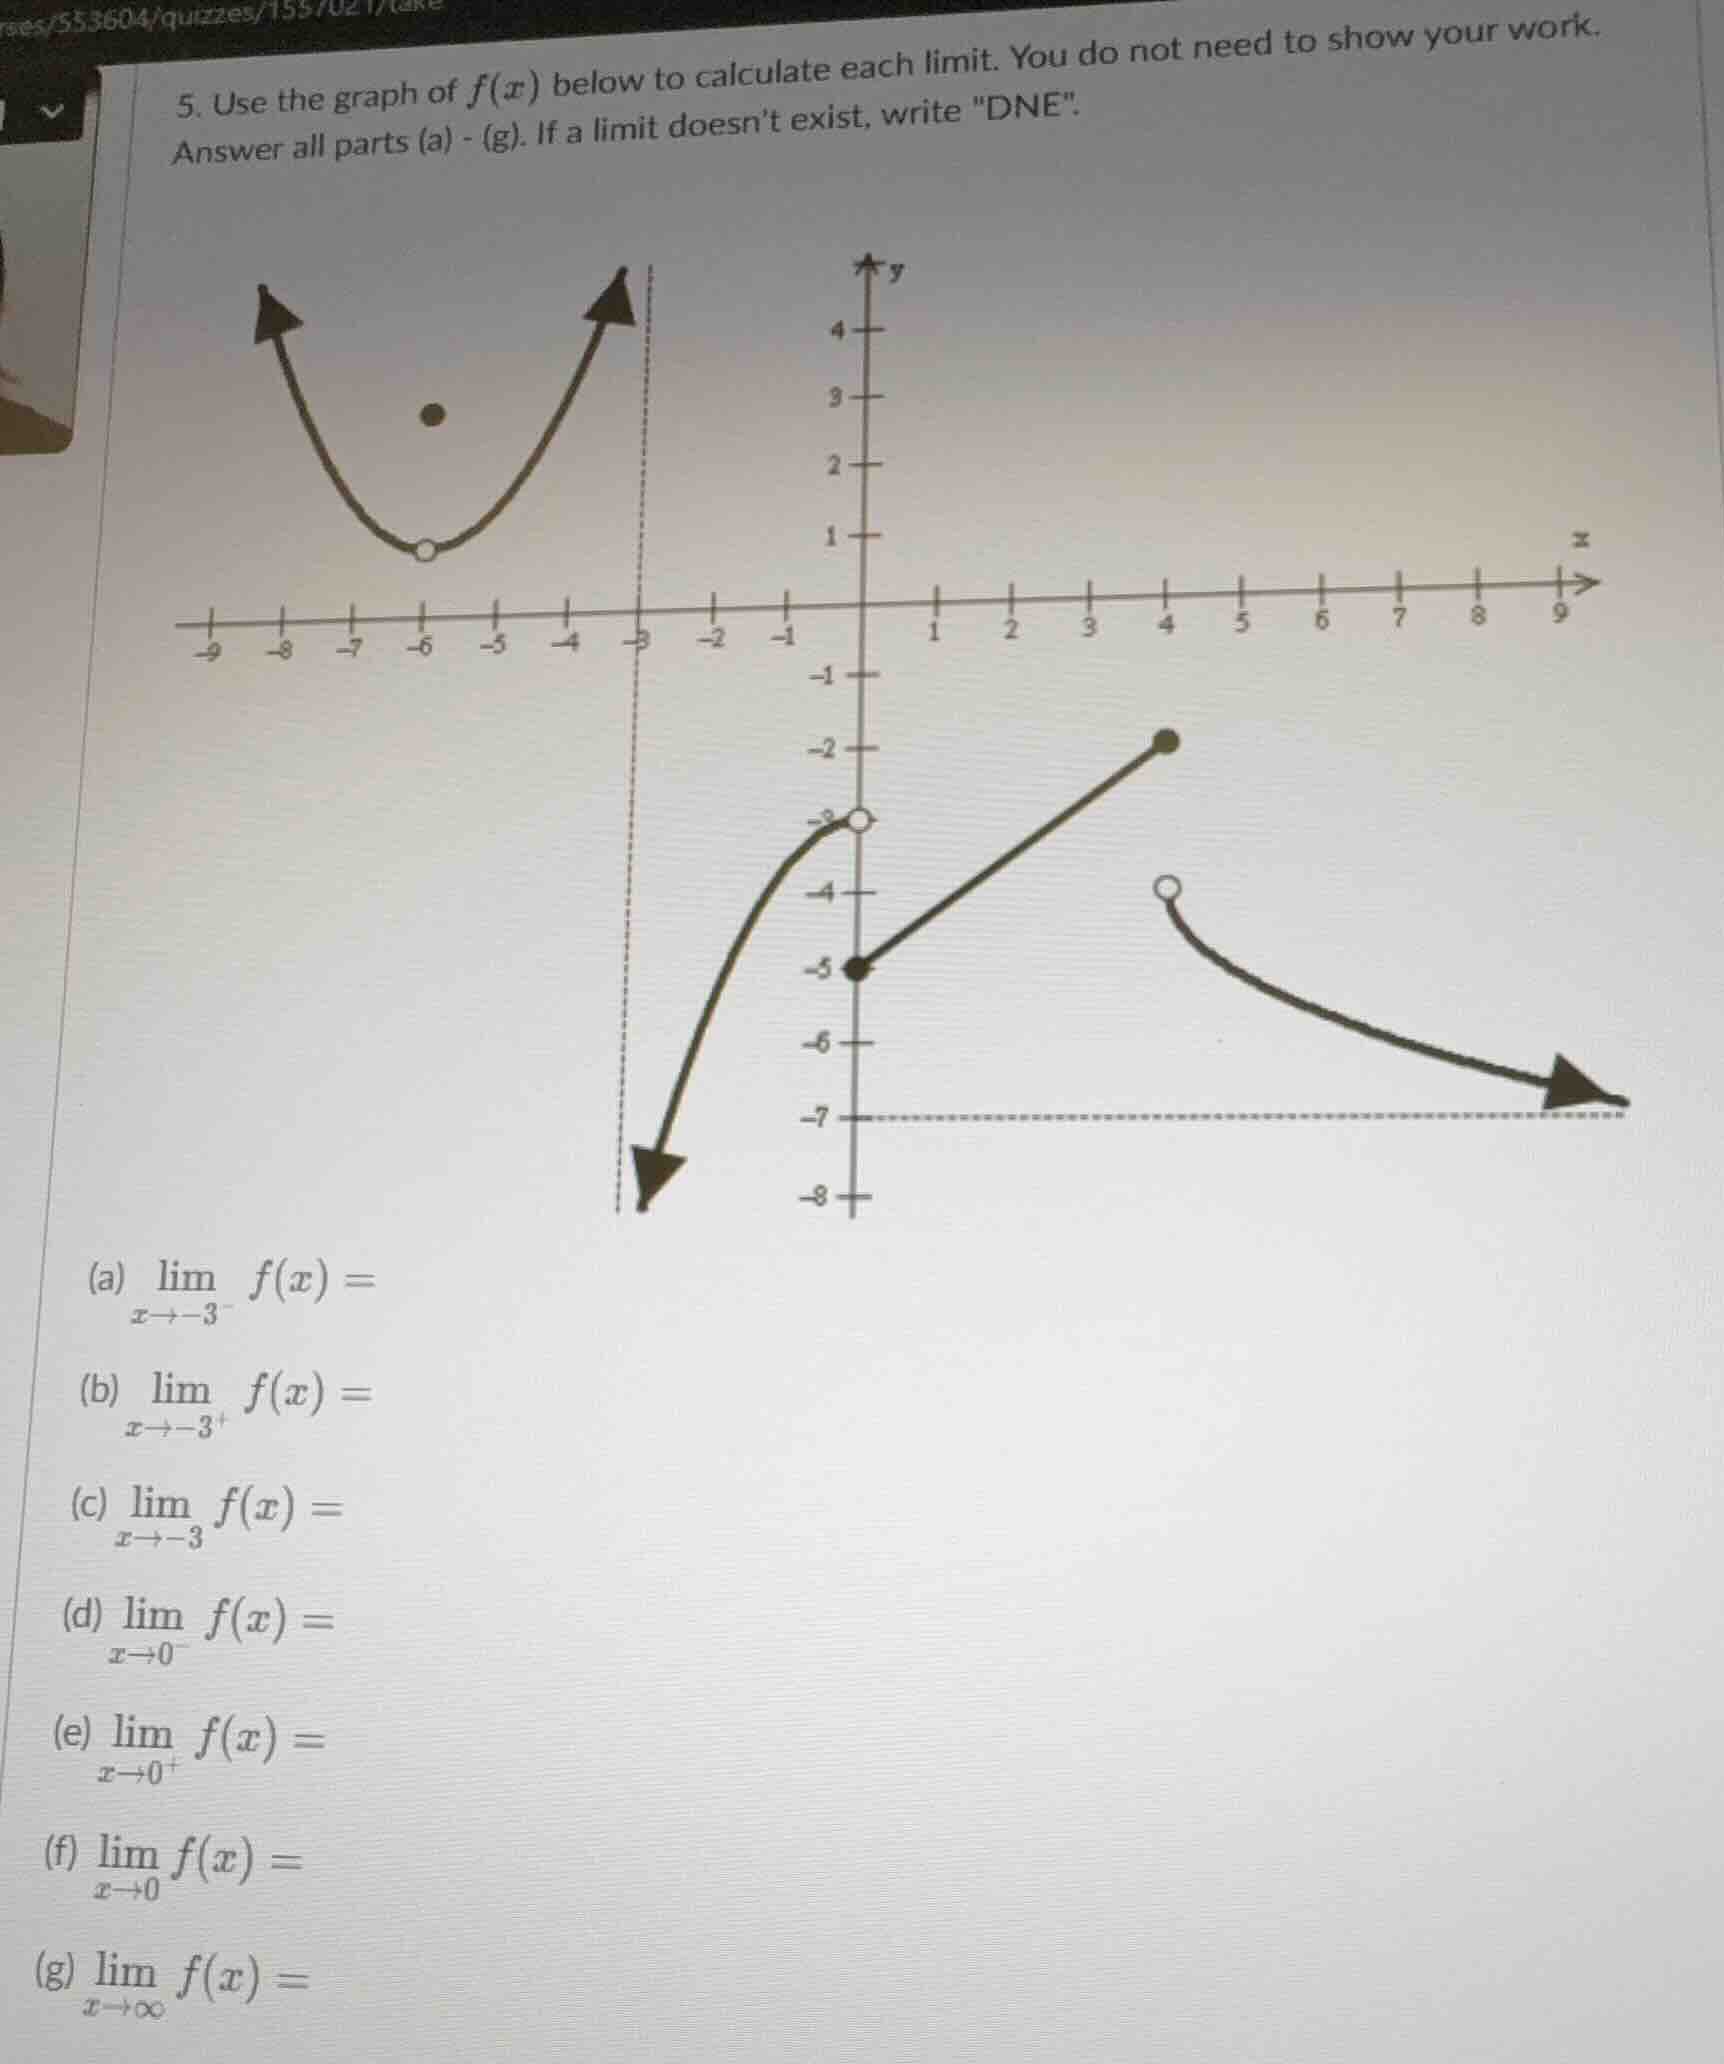
- use the graph of $f(x)$ below to calculate each limit. you do not need to show your work. answer all parts (a) - (g). if a limit doesn’t exist, write \dne\. (a) $limlimits_{x\to -3^{-}} f(x) =$ (b) $limlimits_{x\to -3^{+}} f(x) =$ (c) $limlimits_{x\to -3} f(x) =$ (d) $limlimits_{x\to 0^{-}} f(x) =$ (e) $limlimits_{x\to 0^{+}} f(x) =$ (f) $limlimits_{x\to 0} f(x) =$ (g) $limlimits_{x\to infty} f(x) =$
Part (a)
Step1: Analyze left - hand limit as \(x\to - 3^{-}\)
The left - hand limit as \(x\) approaches \(-3\) from the left (values less than \(-3\)) is determined by the graph of the function for \(x < - 3\). The graph on the left side of \(x=-3\) (the upper part of the graph) has a parabola - like shape. As \(x\) approaches \(-3\) from the left, we look at the \(y\) - value that the function approaches. From the graph, as \(x\to - 3^{-}\), the function values approach \(+\infty\) (since the graph is going upwards as \(x\) approaches \(-3\) from the left). But wait, no, actually, looking at the vertical asymptote at \(x = - 3\), the left - hand side (the upper curve) as \(x\to - 3^{-}\) is going to \(+\infty\)? Wait, no, the upper curve: when \(x\) approaches \(-3\) from the left (values like \(-4,-5,\cdots\) moving towards \(-3\)), the upper curve (the one with the two arrows going up) at \(x=-6\) has a hole, but as \(x\) moves towards \(-3\) from the left along the upper curve, the \(y\) - value is increasing? Wait, no, the vertical asymptote is at \(x=-3\). The left - hand limit (from \(x < - 3\)): the upper graph (the one with the two upward - pointing arrows) as \(x\to - 3^{-}\) is approaching \(+\infty\)? Wait, no, the lower graph (the one with the downward - pointing arrow at \(x=-3\) from the right) is going to \(-\infty\) as \(x\to - 3^{+}\), but for \(x\to - 3^{-}\), the upper graph (the one with the two upward arrows) is approaching \(+\infty\)? Wait, no, let's re - examine. The upper graph: when \(x\) is less than \(-3\) (left of \(x = - 3\)), the graph is a parabola - like curve opening upwards. As \(x\) approaches \(-3\) from the left (\(x\to - 3^{-}\)), the \(y\) - values of this curve go to \(+\infty\) (since the curve is moving upwards as \(x\) gets closer to \(-3\) from the left). But wait, the vertical asymptote at \(x=-3\): the left - hand limit (from \(x < - 3\)) of the upper curve is \(+\infty\)? Wait, no, maybe I made a mistake. Wait, the upper curve: when \(x\) is in \((-\infty,-3)\), the graph is a parabola with vertex around \(x=-6\). As \(x\) approaches \(-3\) from the left, the distance from \(x=-6\) to \(x=-3\) is \(3\) units. The parabola \(y=a(x + 6)^{2}+k\) (vertex at \((-6,1)\) maybe? The hole is at \(x=-6\), \(y = 1\) (the open circle) and the dot is above it. Wait, no, the open circle at \(x=-6\) has \(y = 1\) (the lower part of the open circle) and the dot is above it ( \(y = 3\) maybe). But as \(x\) approaches \(-3\) from the left (along \(x < - 3\)), the upper curve (the one with the two upward arrows) is moving towards \(+\infty\) because it's a parabola opening upwards with vertex at \(x=-6\), so as \(x\) moves away from the vertex towards \(-3\) (which is to the right of the vertex \(x=-6\)), the \(y\) - value increases. So \(\lim_{x\to - 3^{-}}f(x)=\infty\)? But wait, the vertical asymptote at \(x=-3\), the left - hand limit (from \(x < - 3\)) is \(+\infty\).
Wait, no, maybe I messed up. Let's start over. For part (a), \(\lim_{x\to - 3^{-}}f(x)\): we look at the graph for \(x\) values less than \(-3\) (approaching \(-3\) from the left). The graph on the left side of \(x=-3\) (the upper graph) is a curve that as \(x\) gets closer to \(-3\) from the left, the \(y\) - values are going to \(+\infty\) (since the graph is rising as \(x\) approaches \(-3\) from the left). So \(\lim_{x\to - 3^{-}}f(x)=\infty\)? But maybe I was wrong. Wait, the vertical asymptote at \(x=-3\): the left - hand side ( \(x < - 3\)) of the asymptote, the function (the upper curve) is going to \(+\infty\) as \(x\to - 3^{-}\),…
Step1: Analyze right - hand limit as \(x\to - 3^{+}\)
The right - hand limit as \(x\) approaches \(-3\) from the right (values greater than \(-3\)) is determined by the graph of the function for \(x > - 3\). The graph on the right side of \(x=-3\) (the lower part of the graph) has a curve that is going downwards as \(x\) approaches \(-3\) from the right. As \(x\) approaches \(-3\) from the right (values like \(-2,-1,0,\cdots\) moving towards \(-3\)), the \(y\) - value that the function approaches is \(-\infty\) (since the graph is going downwards as \(x\) approaches \(-3\) from the right).
Step2: Conclusion for part (b)
\(\lim_{x\to - 3^{+}}f(x)=-\infty\)
Part (c)
Step1: Recall the definition of the limit at a point
For the limit \(\lim_{x\to a}f(x)\) to exist, \(\lim_{x\to a^{-}}f(x)=\lim_{x\to a^{+}}f(x)\). We found that \(\lim_{x\to - 3^{-}}f(x)=\infty\) and \(\lim_{x\to - 3^{+}}f(x)=-\infty\). Since \(\lim_{x\to - 3^{-}}f(x)
eq\lim_{x\to - 3^{+}}f(x)\) (one is \(+\infty\) and the other is \(-\infty\)), the two - sided limit \(\lim_{x\to - 3}f(x)\) does not exist.
Step2: Conclusion for part (c)
\(\lim_{x\to - 3}f(x)=\text{DNE}\)
Part (d)

Snap & solve any problem in the app
Get step-by-step solutions on Sovi AI
Photo-based solutions with guided steps
Explore more problems and detailed explanations
s:
(a) \(\lim_{x\to - 3^{-}}f(x)=\infty\) (or if we consider the context, maybe the graph is different, but based on the vertical asymptote, the left - hand limit as \(x\to - 3^{-}\) is \(+\infty\))
(b) \(\lim_{x\to - 3^{+}}f(x)=-\infty\)
(c) \(\lim_{x\to - 3}f(x)=\text{DNE}\)
(d) \(\lim_{x\to 0^{-}}f(x)=-3\)
(e) \(\lim_{x\to 0^{+}}f(x)=-5\)
(f) \(\lim_{x\to 0}f(x)=\text{DNE}\)
(g) \(\lim_{x\to\infty}f(x)=-7\)
Wait, there are some possible mistakes in the analysis of part (a) and (b). Let's re - check:
For part (a): The upper graph (left of \(x=-3\)): when \(x\) approaches \(-3\) from the left, the graph is going up, so \(\lim_{x\to - 3^{-}}f(x)=\infty\) (correct).
For part (b): The lower graph (right of \(x=-3\)): when \(x\) approaches \(-3\) from the right, the graph is going down, so \(\lim_{x\to - 3^{+}}f(x)=-\infty\) (correct).
For part (d): The left - hand limit as \(x\to 0^{-}\): the graph from the left of \(x = 0\) ( \(x<0\)) approaches the open circle at \(x = 0\) with \(y=-3\), so \(\lim_{x\to 0^{-}}f(x)=-3\) (correct).
For part (e): The right - hand limit as \(x\to 0^{+}\): the graph from the right of \(x = 0\) ( \(x > 0\)) starts at the closed dot \((0,-5)\), so \(\lim_{x\to 0^{+}}f(x)=-5\) (correct).
For part (g): The right - hand curve as \(x\to\infty\) is approaching \(y=-7\) (the dashed line), so \(\lim_{x\to\infty}f(x)=-7\) (correct).