QUESTION IMAGE
Question
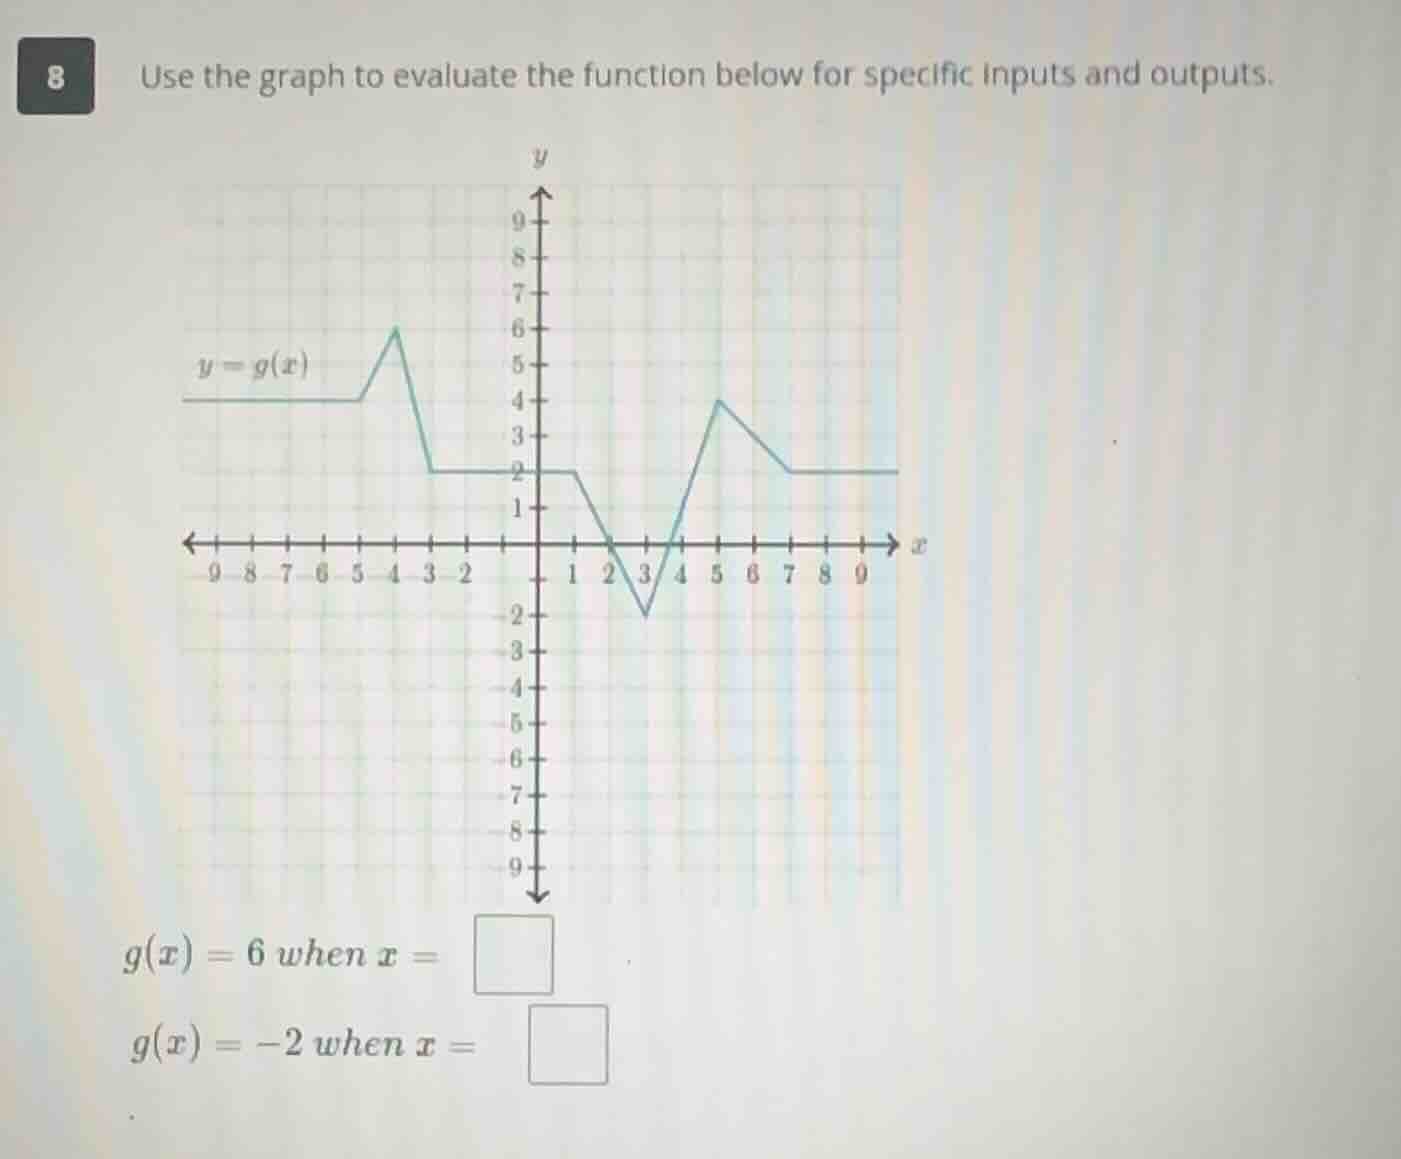
8 use the graph to evaluate the function below for specific inputs and outputs.
y = g(x)
g(x) = 6 when x =
g(x) = -2 when x =
Step1: Find x when g(x)=6
Look at the graph of \( y = g(x) \). We need to find the \( x \)-value where the \( y \)-value (output) is 6. From the graph, the peak with \( y = 6 \) occurs at \( x = -4 \) (since moving along the x-axis, the point with \( y = 6 \) is at \( x = -4 \)).
Step2: Find x when g(x)=-2
Now, find the \( x \)-value where \( y = -2 \). Looking at the graph, the valley with \( y = -2 \) is at \( x = 3 \) (checking the x-coordinate of the point where \( y = -2 \)).

Snap & solve any problem in the app
Get step-by-step solutions on Sovi AI
Photo-based solutions with guided steps
Explore more problems and detailed explanations
For \( g(x) = 6 \), \( x = -4 \); for \( g(x) = -2 \), \( x = 3 \)