QUESTION IMAGE
Question
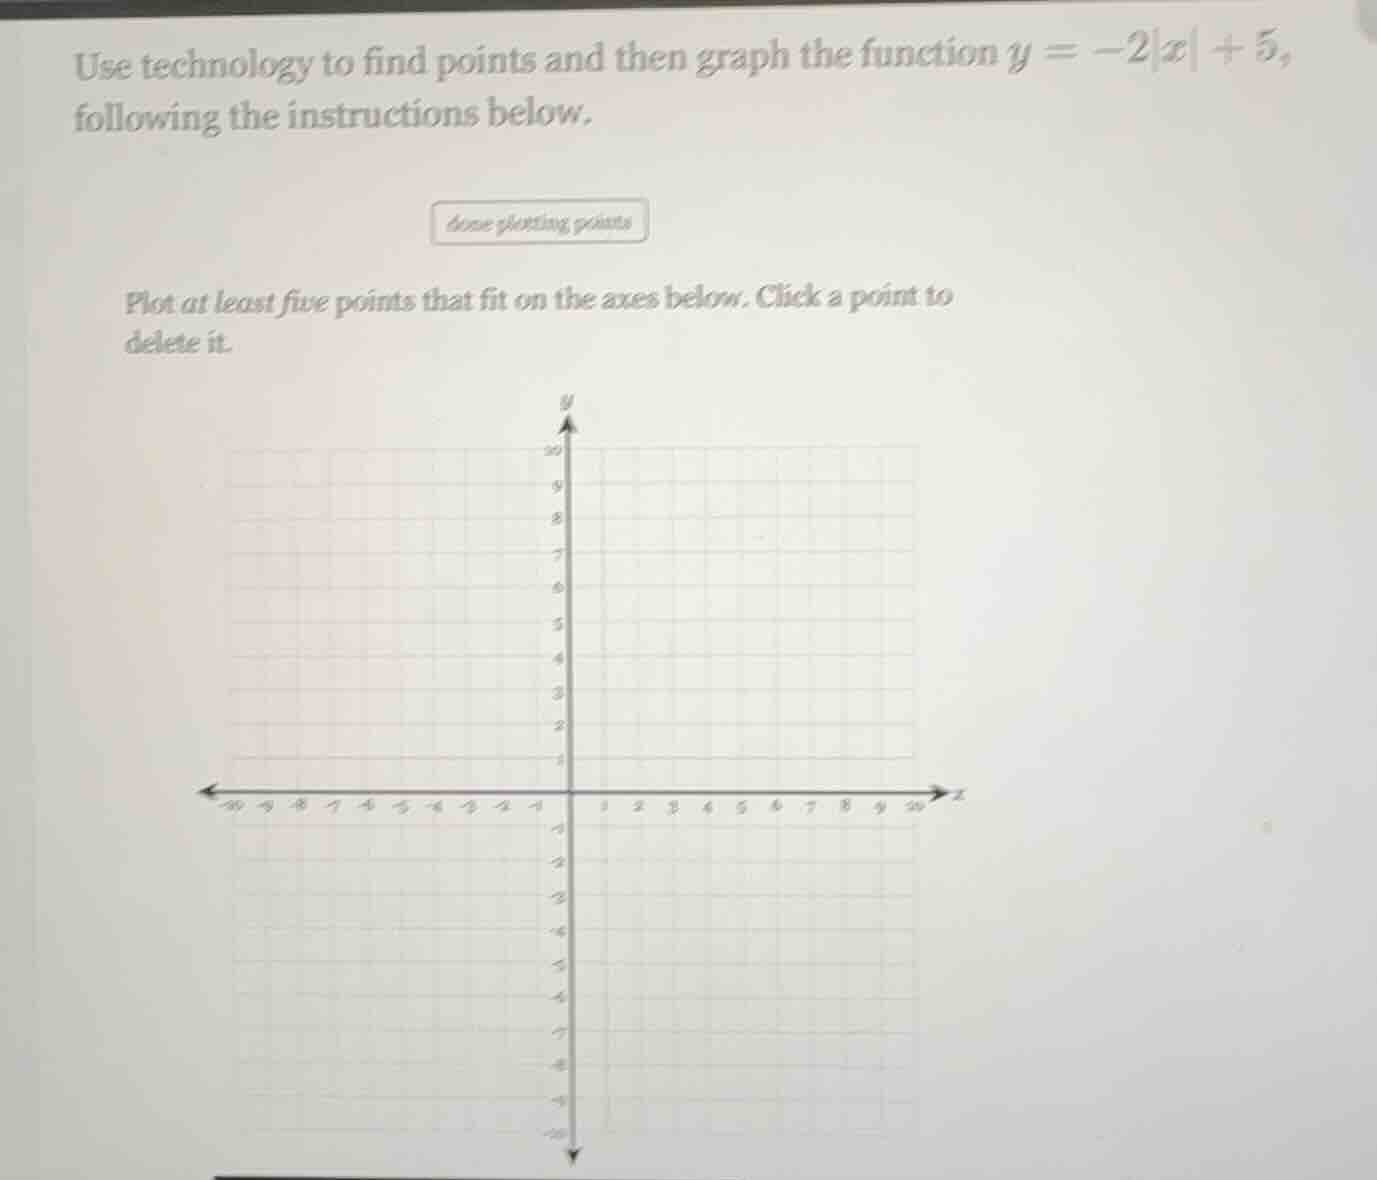
use technology to find points and then graph the function $y = -2|x| + 5$, following the instructions below.
done plotting points
plot at least five points that fit on the axes below. click a point to delete it.
graph with x-axis from -10 to 10 and y-axis from -10 to 10, grid lines, and axes labeled x and y
Step1: Choose x-values, solve for y
Select $x = -2, -1, 0, 1, 2$ (symmetric values simplify plotting).
- For $x=-2$: $y = -2|-2| + 5 = -2(2) + 5 = 1$
- For $x=-1$: $y = -2|-1| + 5 = -2(1) + 5 = 3$
- For $x=0$: $y = -2|0| + 5 = 0 + 5 = 5$
- For $x=1$: $y = -2|1| + 5 = -2(1) + 5 = 3$
- For $x=2$: $y = -2|2| + 5 = -2(2) + 5 = 1$
Step2: List valid coordinate points
Compile the $(x,y)$ pairs: $(-2,1), (-1,3), (0,5), (1,3), (2,1)$
Step3: Plot points on the grid
Mark each pair on the provided coordinate plane, then draw a V-shaped line connecting them (opening downward, vertex at $(0,5)$).

Snap & solve any problem in the app
Get step-by-step solutions on Sovi AI
Photo-based solutions with guided steps
Explore more problems and detailed explanations
The five points to plot are:
$(-2, 1)$, $(-1, 3)$, $(0, 5)$, $(1, 3)$, $(2, 1)$
When connected, they form a downward-opening V-shaped graph with vertex at $(0,5)$.