QUESTION IMAGE
Question
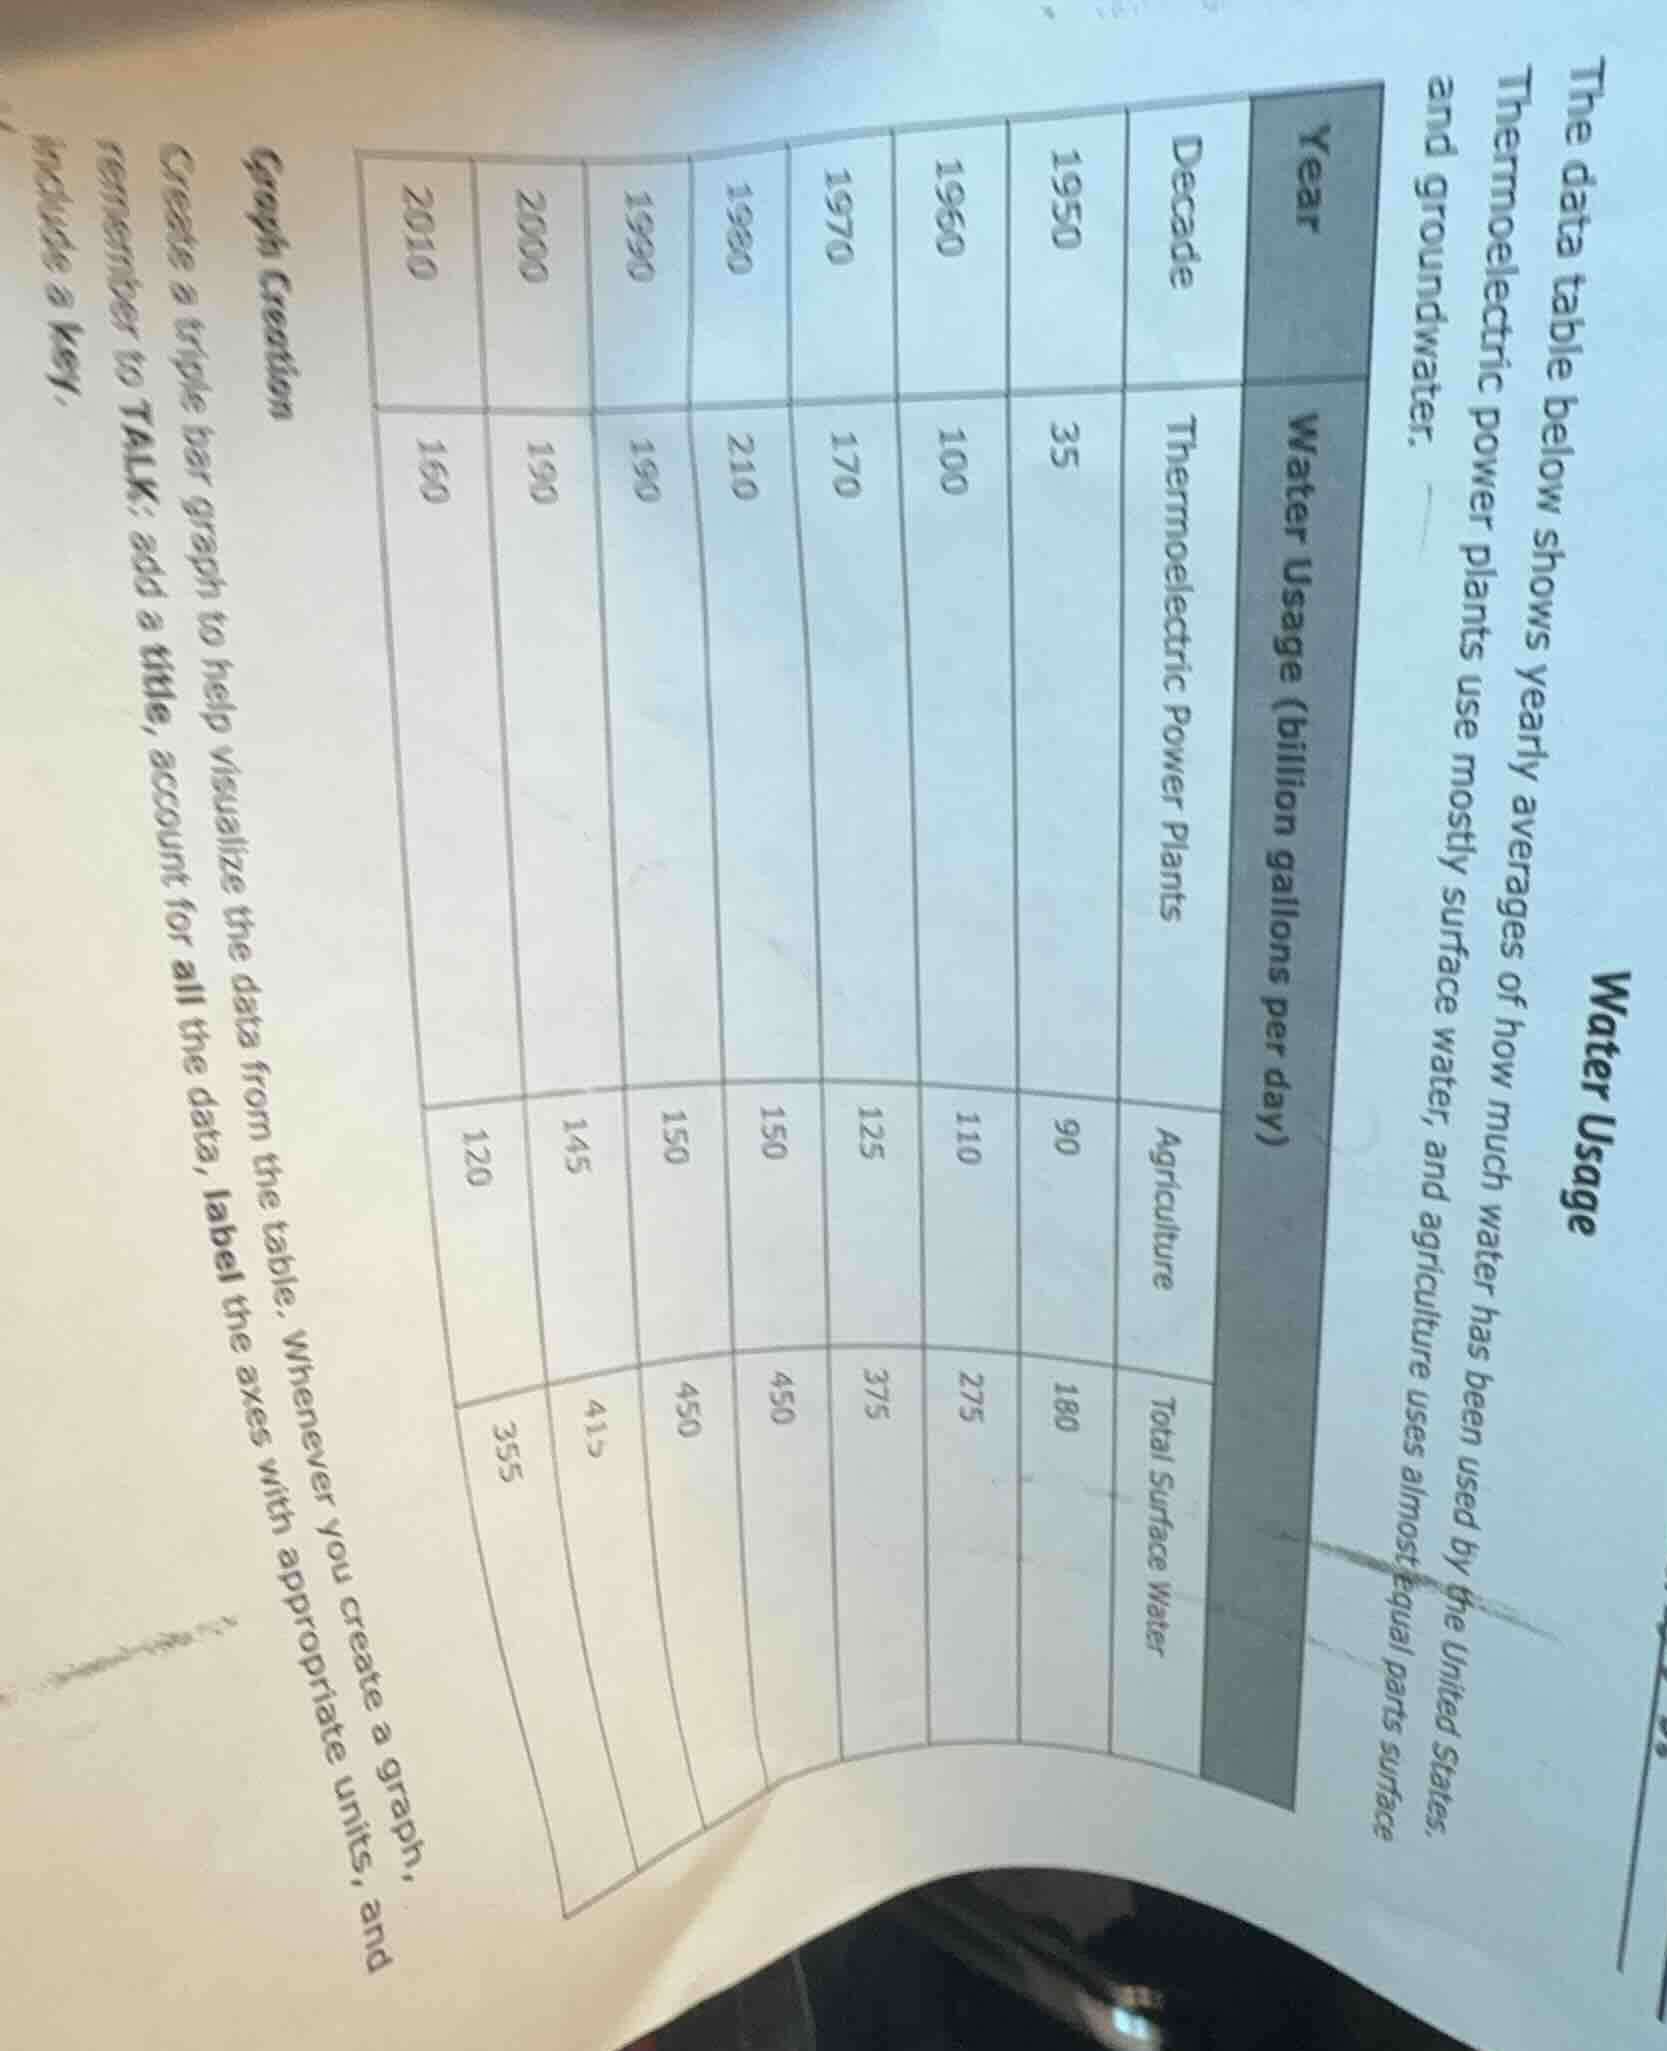
water usage
the data table below shows yearly averages of how much water has been used by the united states. thermoelectric power plants use mostly surface water, and agriculture uses almost equal parts surface and groundwater.
graph creation
create a triple bar graph to help visualize the data from the table. whenever you create a graph, remember to talk: add a title, account for all the data, label the axes with appropriate units, and include a key.
Brief Explanations
- Graph Setup: Use a triple bar graph where each decade on the x-axis has three bars: one for Thermoelectric Power Plants, one for Agriculture, and one for Total Surface Water.
- Axes & Title: Label the x-axis "Decade" with values 1950, 1960, 1970, 1980, 1990, 2000, 2010. Label the y-axis "Water Usage (billion gallons per day)" with a scale that goes from 0 to 475 to fit the highest value (450). Add a title like "U.S. Water Usage by Category, 1950-2010".
- Plot Data: For each decade, draw bars with heights matching the table values:
- 1950: 35 (Thermoelectric), 90 (Agriculture), 180 (Total Surface)
- 1960: 100, 110, 275
- 1970: 170, 125, 375
- 1980: 210, 150, 450
- 1990: 190, 150, 450
- 2000: 190, 145, 415
- 2010: 160, 120, 355
- Key: Include a key to identify which bar corresponds to each water usage category.

Snap & solve any problem in the app
Get step-by-step solutions on Sovi AI
Photo-based solutions with guided steps
Explore more problems and detailed explanations
A properly formatted triple bar graph with:
- X-axis labeled "Decade" (1950, 1960, 1970, 1980, 1990, 2000, 2010)
- Y-axis labeled "Water Usage (billion gallons per day)" (scale 0-475)
- Title: "U.S. Water Usage by Category, 1950-2010"
- Three bars per decade for Thermoelectric Power Plants, Agriculture, and Total Surface Water, plotted to match the table values
- A key identifying each bar category