QUESTION IMAGE
Question
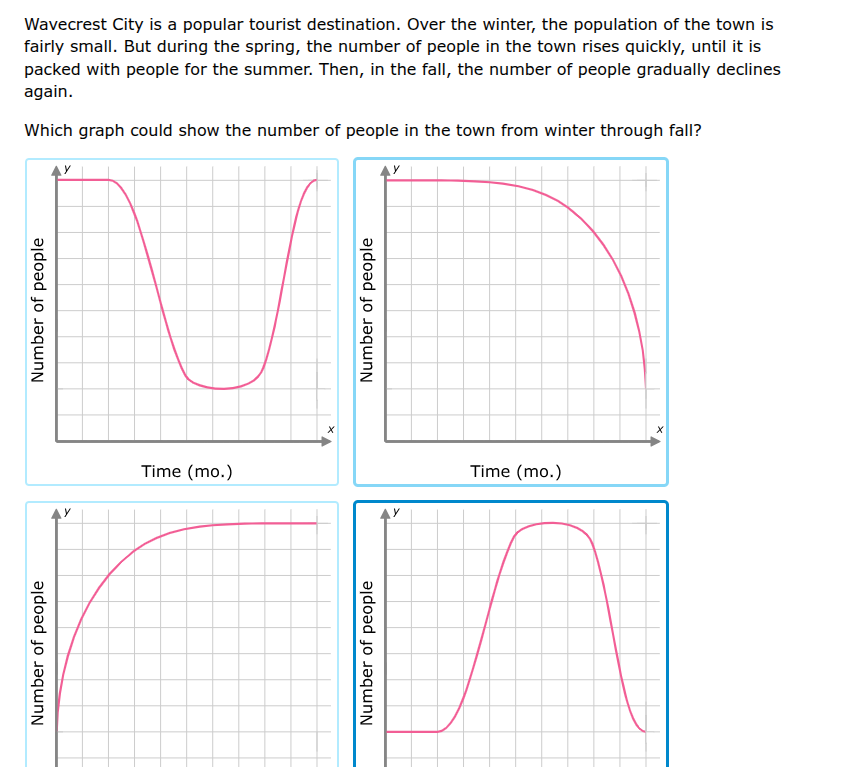
wavecrest city is a popular tourist destination. over the winter, the population of the town is fairly small. but during the spring, the number of people in the town rises quickly, until it is packed with people for the summer. then, in the fall, the number of people gradually declines again. which graph could show the number of people in the town from winter through fall?
Step1: Match winter population
The problem states winter population is small and stable. We look for a graph with an initial flat, low segment. This eliminates the top-right (only declines) and bottom-left (starts low but rises immediately) graphs, leaving top-left and bottom-right.
Step2: Match spring trend
In spring, population rises quickly. Both remaining graphs have a sharp upward segment, so we proceed.
Step3: Match summer trend
Summer has a stable, high population (packed with people). The top-left graph drops to a low after rising, which contradicts this. The bottom-right graph has a flat high segment after rising, which fits.
Step4: Match fall trend
Fall has a gradual decline in population. The bottom-right graph's final downward segment matches this, confirming it is the correct graph.

Snap & solve any problem in the app
Get step-by-step solutions on Sovi AI
Photo-based solutions with guided steps
Explore more problems and detailed explanations
Bottom-right graph (the one with: low flat line in winter, sharp rise in spring, flat high line in summer, sharp decline in fall)