QUESTION IMAGE
Question
wednesday, 1/21
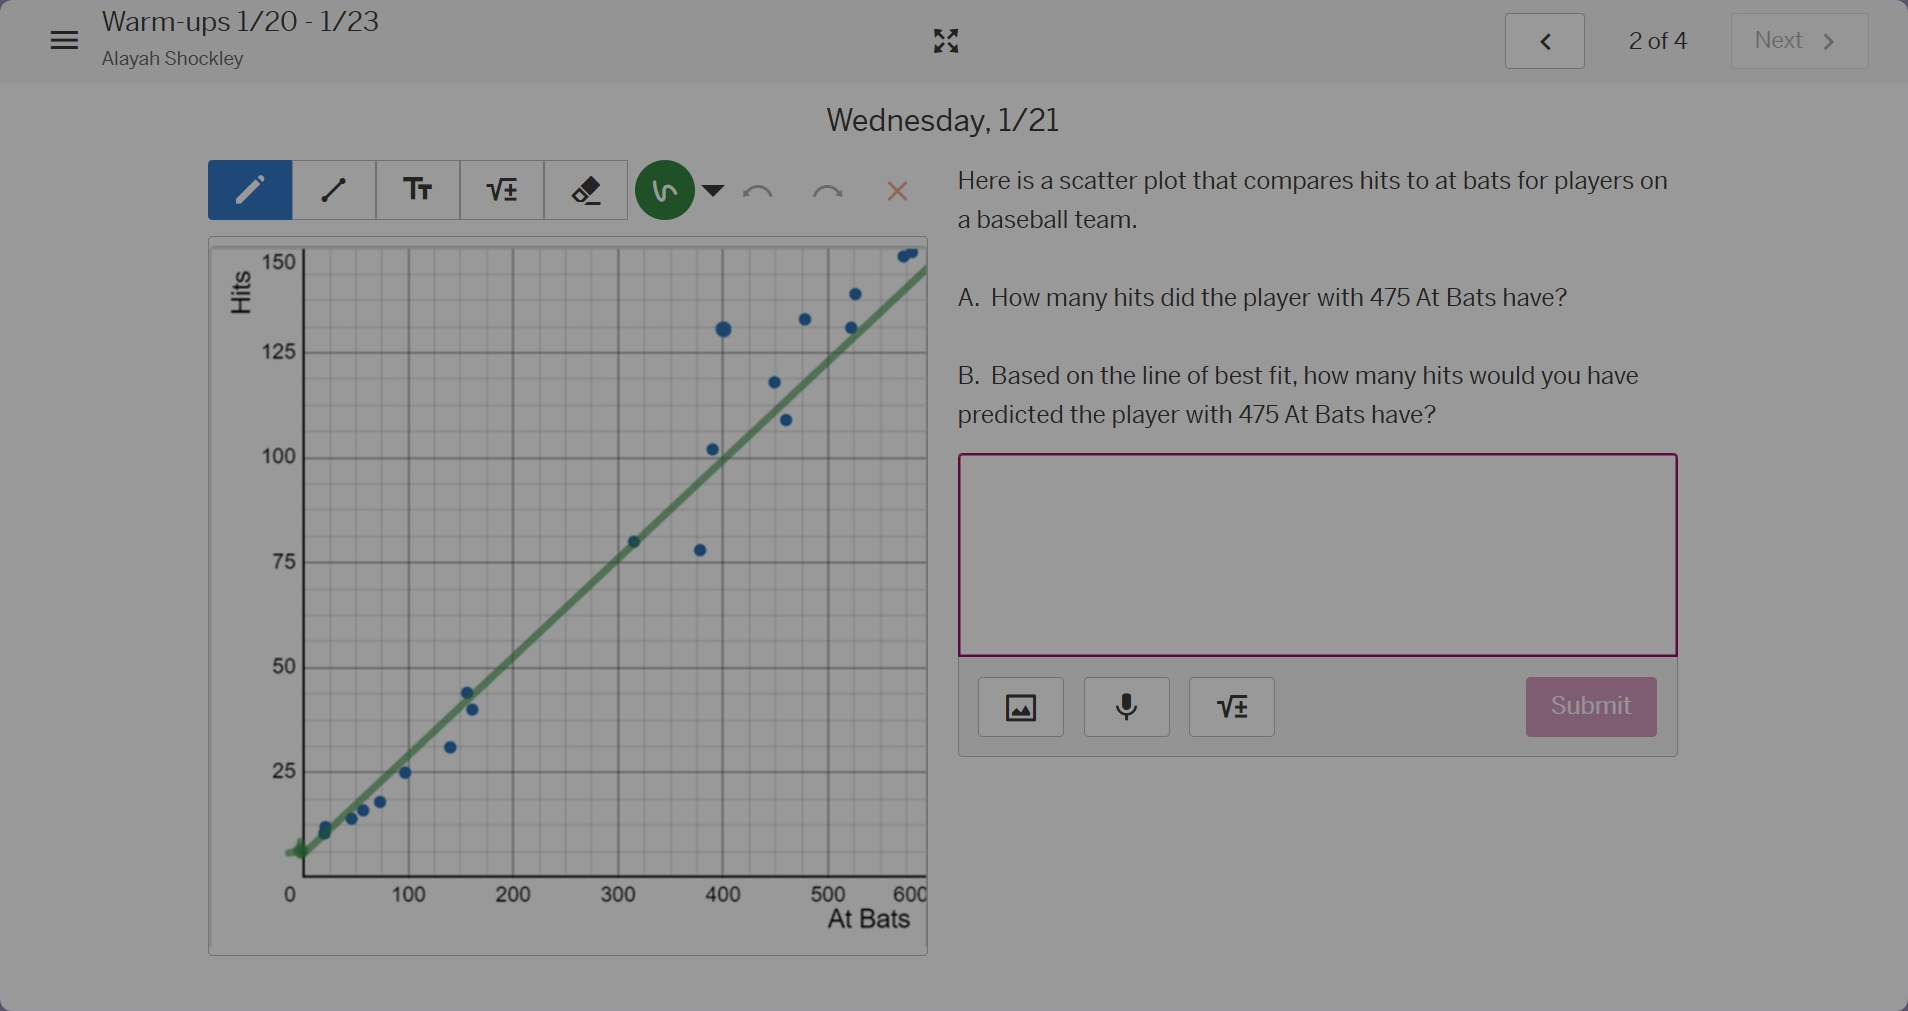
here is a scatter plot that compares hits to at bats for players on a baseball team.
a. how many hits did the player with 475 at bats have?
b. based on the line of best fit, how many hits would you have predicted the player with 475 at bats have?
Part A
Step1: Locate 475 At Bats
Find the x - value (At Bats) of 475 on the scatter plot's x - axis.
Step2: Find corresponding Hits
Look at the data point (dot) with x - value 475. From the scatter plot, the y - value (Hits) for this point is 130 (approximate, by reading the y - axis for the dot at x = 475).
Step1: Identify the line of best fit
The green line is the line of best fit.
Step2: Find the y - value at x = 475
Find the point on the line of best fit where x (At Bats) is 475. By looking at the line, when x = 475, the y - value (Hits) on the line is 125 (approximate, by following the line to x = 475 and reading the y - axis).

Snap & solve any problem in the app
Get step-by-step solutions on Sovi AI
Photo-based solutions with guided steps
Explore more problems and detailed explanations
130 (approximate, depending on the exact plot reading)