QUESTION IMAGE
Question
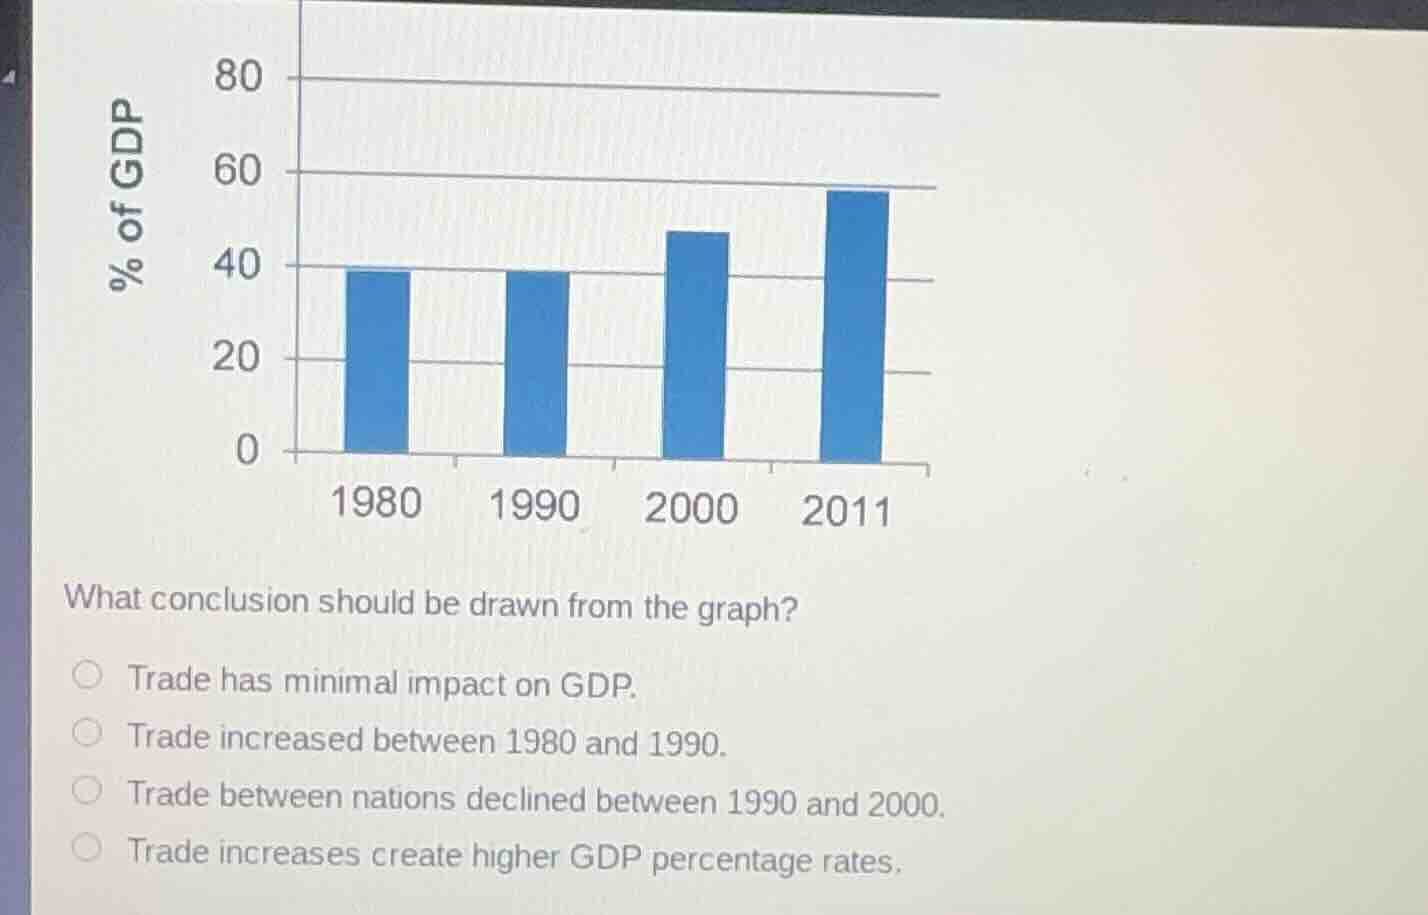
what conclusion should be drawn from the graph?○ trade has minimal impact on gdp.○ trade increased between 1980 and 1990.○ trade between nations declined between 1990 and 2000.○ trade increases create higher gdp percentage rates.
Brief Explanations
- Evaluate each option against the bar graph:
- "Trade has minimal impact on GDP": The graph shows trade as a consistent, growing share of GDP (reaching nearly 60%), so this is false.
- "Trade increased between 1980 and 1990": The bars for 1980 and 1990 are equal, so trade did not increase, this is false.
- "Trade between nations declined between 1990 and 2000": The bar for 2000 is taller than 1990, so trade rose, this is false.
- "Trade increases create higher GDP percentage rates": From 1990 to 2000 and 2000 to 2011, as trade increases, its share of GDP rises, which matches this statement.

Snap & solve any problem in the app
Get step-by-step solutions on Sovi AI
Photo-based solutions with guided steps
Explore more problems and detailed explanations
Trade increases create higher GDP percentage rates.