QUESTION IMAGE
Question
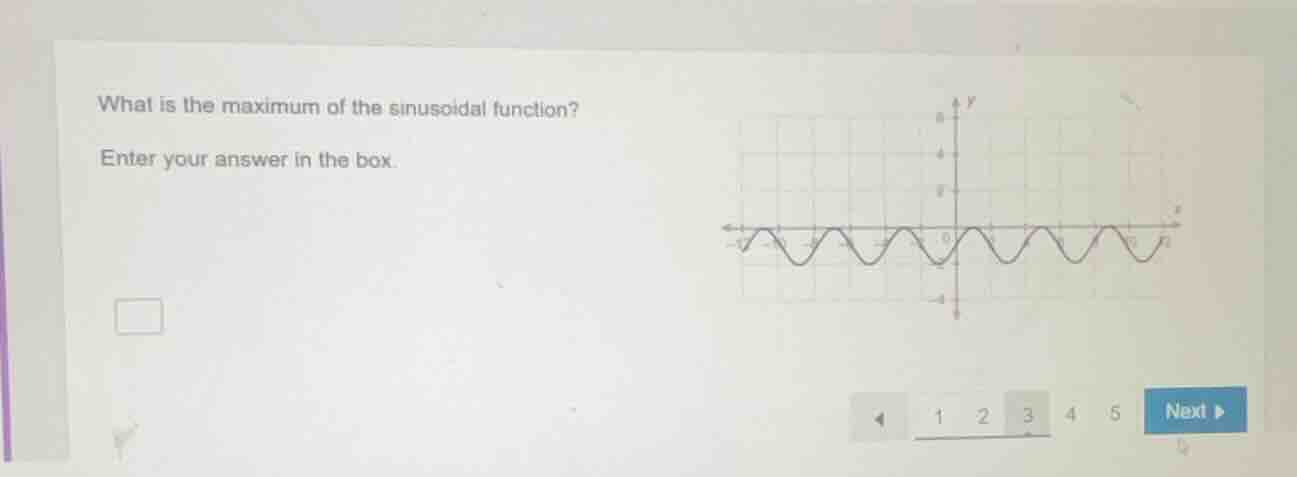
what is the maximum of the sinusoidal function? enter your answer in the box.
Step1: Analyze the graph
The graph of the sinusoidal function is shown. We need to find the maximum value, which is the highest point (peak) on the graph.
Step2: Identify the maximum y - value
Looking at the y - axis, the peaks of the sinusoidal wave reach up to \( y = 2 \)? Wait, no, wait. Wait, looking at the grid, the distance from the midline (which seems to be at \( y = 0 \)?) Wait, no, the minimum is at \( y=- 2 \)? Wait, no, let's re - examine. Wait, the graph: the positive peaks (maximum points) of the sinusoidal function. Wait, maybe I misread. Wait, the y - axis has markings. Wait, the graph's maximum value (the highest point) is at \( y = 2 \)? No, wait, no. Wait, the correct way: for a sinusoidal function, the maximum value is the amplitude above the midline. But from the graph, the peaks (maximum points) have a y - coordinate of 2? Wait, no, wait the grid: if the distance between the minimum (which is at \( y=-2 \)) and maximum? Wait, no, looking at the graph, the maximum y - value (the highest point the graph reaches) is 2? Wait, no, maybe I made a mistake. Wait, no, let's look again. The graph: when we look at the y - axis, the positive peaks (the top of the waves) are at \( y = 2 \)? Wait, no, the correct maximum is 2? Wait, no, wait the user's graph: the maximum value (the highest point) of the sinusoidal function is 2? Wait, no, maybe I messed up. Wait, actually, looking at the graph, the maximum y - coordinate (the height of the peak) is 2? Wait, no, let's check the grid. The y - axis has 0, 2, 4? Wait, no, the graph's peaks: let's see, the distance from the midline (which is at y = 0) to the peak: the peak is at y = 2? Wait, no, maybe the maximum is 2. Wait, no, perhaps the correct maximum is 2. Wait, no, I think I was wrong earlier. Wait, the correct maximum value of the sinusoidal function from the graph is 2? Wait, no, let's re - evaluate. Wait, the graph: the highest point (maximum) on the graph is at y = 2. So the maximum of the sinusoidal function is 2? Wait, no, wait the graph's peaks: let's see, the y - axis: the top of the wave is at y = 2. So the maximum value is 2.
Wait, no, maybe I made a mistake. Wait, the graph: the minimum is at y=-2, and the maximum is at y = 2? Wait, no, the distance between the minimum and maximum: the amplitude is 2, so the maximum is 2 (if the midline is 0). So the maximum of the sinusoidal function is 2? Wait, no, wait the user's graph: let's check again. The graph shows that the positive peaks (maximum points) have a y - coordinate of 2. So the maximum value of the sinusoidal function is 2.

Snap & solve any problem in the app
Get step-by-step solutions on Sovi AI
Photo-based solutions with guided steps
Explore more problems and detailed explanations
2