QUESTION IMAGE
Question
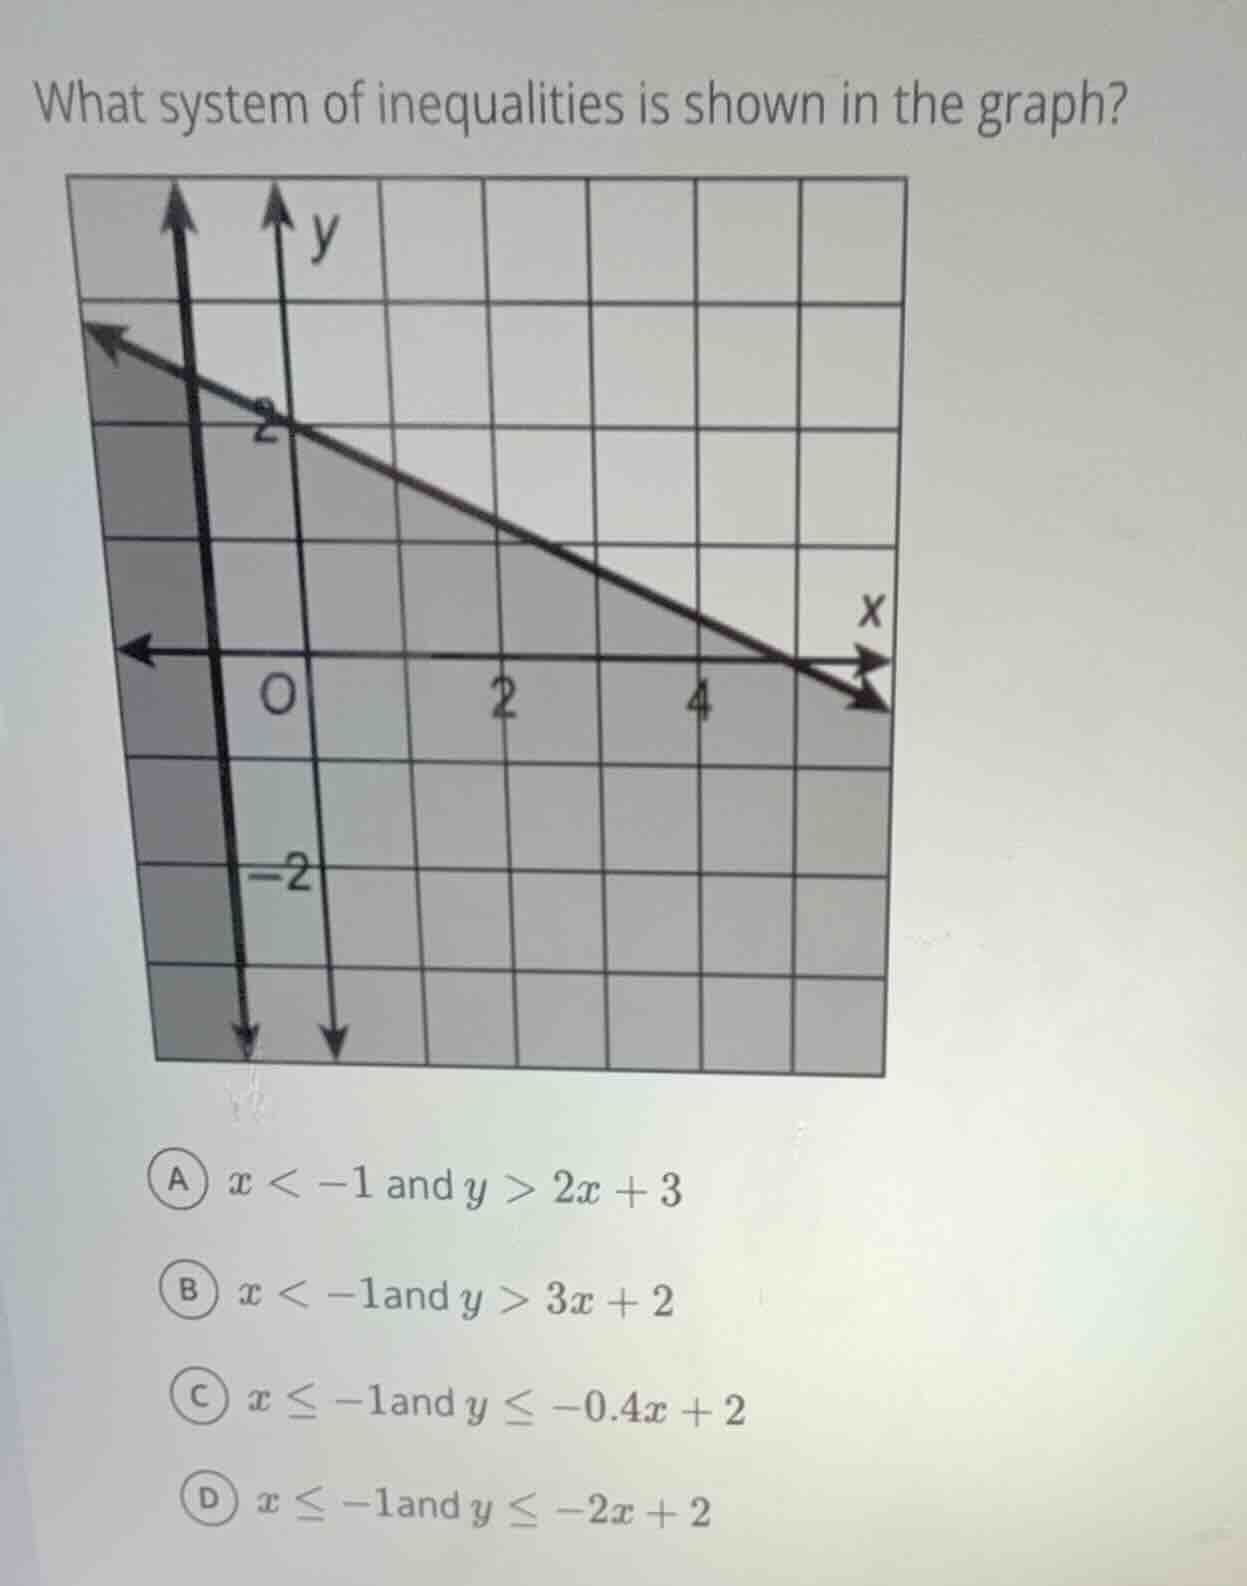
what system of inequalities is shown in the graph?
a $x < -1$ and $y > 2x + 3$
b $x < -1$ and $y > 3x + 2$
c $x \leq -1$ and $y \leq -0.4x + 2$
d $x \leq -1$ and $y \leq -2x + 2$
Step1: Identify vertical boundary
The vertical line is $x=-1$, solid, shaded left.
So inequality: $x \leq -1$
Step2: Find line equation (slope-intercept)
Line passes through $(0,2)$ and $(5,0)$. Slope $m=\frac{0-2}{5-0}=-\frac{2}{5}=-0.4$.
Slope-intercept form: $y = -0.4x + 2$
Step3: Determine inequality for line
Line is solid, shaded below.
Inequality: $y \leq -0.4x + 2$
Step4: Match to options
Combine the two inequalities.

Snap & solve any problem in the app
Get step-by-step solutions on Sovi AI
Photo-based solutions with guided steps
Explore more problems and detailed explanations
C. $x \leq -1$ and $y \leq -0.4x + 2$