QUESTION IMAGE
Question
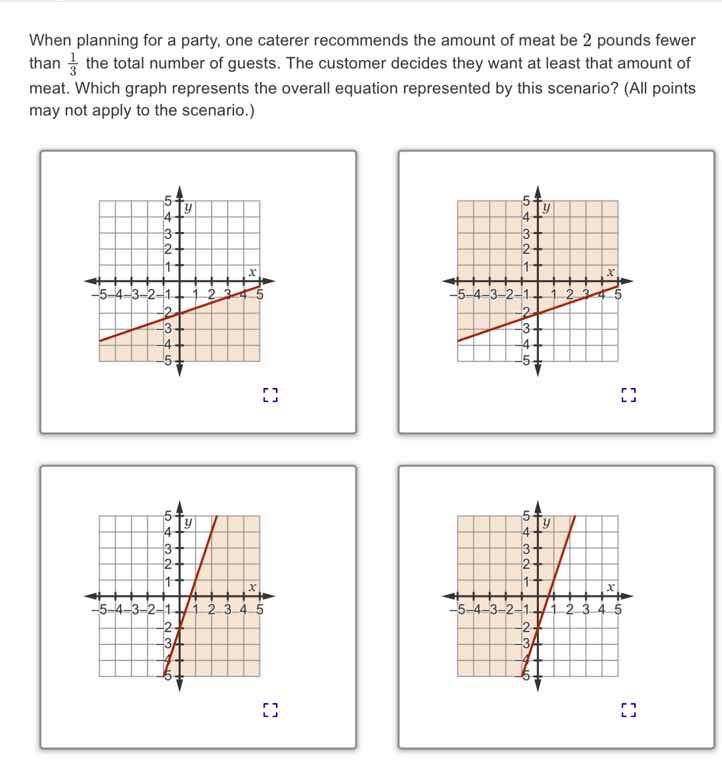
when planning for a party, one caterer recommends the amount of meat be 2 pounds fewer than \\(\frac{1}{3}\\) the total number of guests. the customer decides they want at least that amount of meat. which graph represents the overall equation represented by this scenario? (all points may not apply to the scenario.)
Step1: Define Variables
Let \( x \) be the number of guests and \( y \) be the amount of meat (in pounds). The caterer recommends \( y=\frac{1}{3}x - 2 \). The customer wants at least that amount, so the inequality is \( y\geq\frac{1}{3}x - 2 \).
Step2: Analyze the Line
The equation \( y = \frac{1}{3}x-2 \) is a linear equation with slope \( \frac{1}{3} \) (positive, gentle slope) and y - intercept \( - 2 \). For the inequality \( y\geq\frac{1}{3}x - 2 \), we shade above the line (since \( y \) is greater than or equal to the line's value) and the line should be solid (because the inequality is "greater than or equal to").
Step3: Analyze the Graphs
- The first two graphs have a gentle slope (slope \( \frac{1}{3} \)) and y - intercept \( - 2 \)? Wait, no, wait. Wait, the y - intercept of \( y=\frac{1}{3}x - 2 \) is \( - 2 \)? Wait, no, let's re - calculate. Wait, the equation is \( y=\frac{1}{3}x-2 \). When \( x = 0 \), \( y=-2 \). But looking at the first two graphs, the y - intercept seems to be \( - 2 \)? Wait, no, the first two graphs: let's check the slope. The slope is \( \frac{1}{3} \), which is a small positive slope. The last two graphs have a steep slope (slope 3 or something), so they can be eliminated because our slope is \( \frac{1}{3} \). Now, between the first two graphs: the inequality is \( y\geq\frac{1}{3}x - 2 \), so we shade above the line. Let's check the first graph: the shaded region is below or above? Wait, the first graph: the line is \( y=\frac{1}{3}x - 2 \) (wait, no, maybe I made a mistake in the y - intercept). Wait, let's re - express the problem. The amount of meat is 2 pounds fewer than \( \frac{1}{3} \) the total number of guests. So \( y=\frac{1}{3}x-2 \). The customer wants at least that amount, so \( y\geq\frac{1}{3}x - 2 \). The line \( y=\frac{1}{3}x - 2 \) has a slope of \( \frac{1}{3} \) (rise 1, run 3) and y - intercept at \( (0,-2) \). Now, looking at the first two graphs: the first graph has a shaded region that is above the line? Wait, no, let's check the coordinates. Wait, maybe I mixed up the y - intercept. Wait, maybe the equation is \( y=\frac{1}{3}x - 2 \), but when \( x = 0 \), \( y=-2 \). But in the first two graphs, the y - intercept seems to be \( - 2 \)? Wait, no, the first graph: let's take two points on the line. If \( x = 3 \), then \( y=\frac{1}{3}(3)-2=1 - 2=-1 \). If \( x = 6 \), \( y=\frac{1}{3}(6)-2 = 2 - 2=0 \). So the line passes through \( (3,-1) \) and \( (6,0) \). Now, the first two graphs: the first graph has a solid line (since it's "at least", so inclusive) and the shaded region above the line. Wait, the second graph: let's check the shading. The first graph: the shaded area is below the line? No, wait, maybe I got the inequality direction wrong. Wait, "at least that amount" means the amount of meat \( y \) is greater than or equal to \( \frac{1}{3}x - 2 \), so \( y\geq\frac{1}{3}x - 2 \), so we shade above the line. Now, the first two graphs: the line is \( y=\frac{1}{3}x - 2 \) (slope \( \frac{1}{3} \)), and the shaded region: let's see, the first graph's shaded region is below the line? No, wait, maybe the y - intercept is wrong. Wait, maybe the equation is \( y=\frac{1}{3}x-2 \), but when \( x = 0 \), \( y = - 2 \), but in the first two graphs, the y - intercept is \( - 2 \)? Wait, no, the first graph: the line crosses the y - axis at \( - 2 \)? Wait, the first graph's line: when \( x = 0 \), \( y=-2 \), and the slope is \( \frac{1}{3} \). The shaded region: for the inequality \( y\geq\frac{1}{3}x - 2 \), we shade above the line. The first graph: let'…

Snap & solve any problem in the app
Get step-by-step solutions on Sovi AI
Photo-based solutions with guided steps
Explore more problems and detailed explanations
The graph in the top - left corner (the first graph among the four) represents the scenario. (Assuming the first graph has a solid line with slope \( \frac{1}{3} \), y - intercept \( - 2 \), and shading above the line to represent \( y\geq\frac{1}{3}x - 2 \))