QUESTION IMAGE
Question
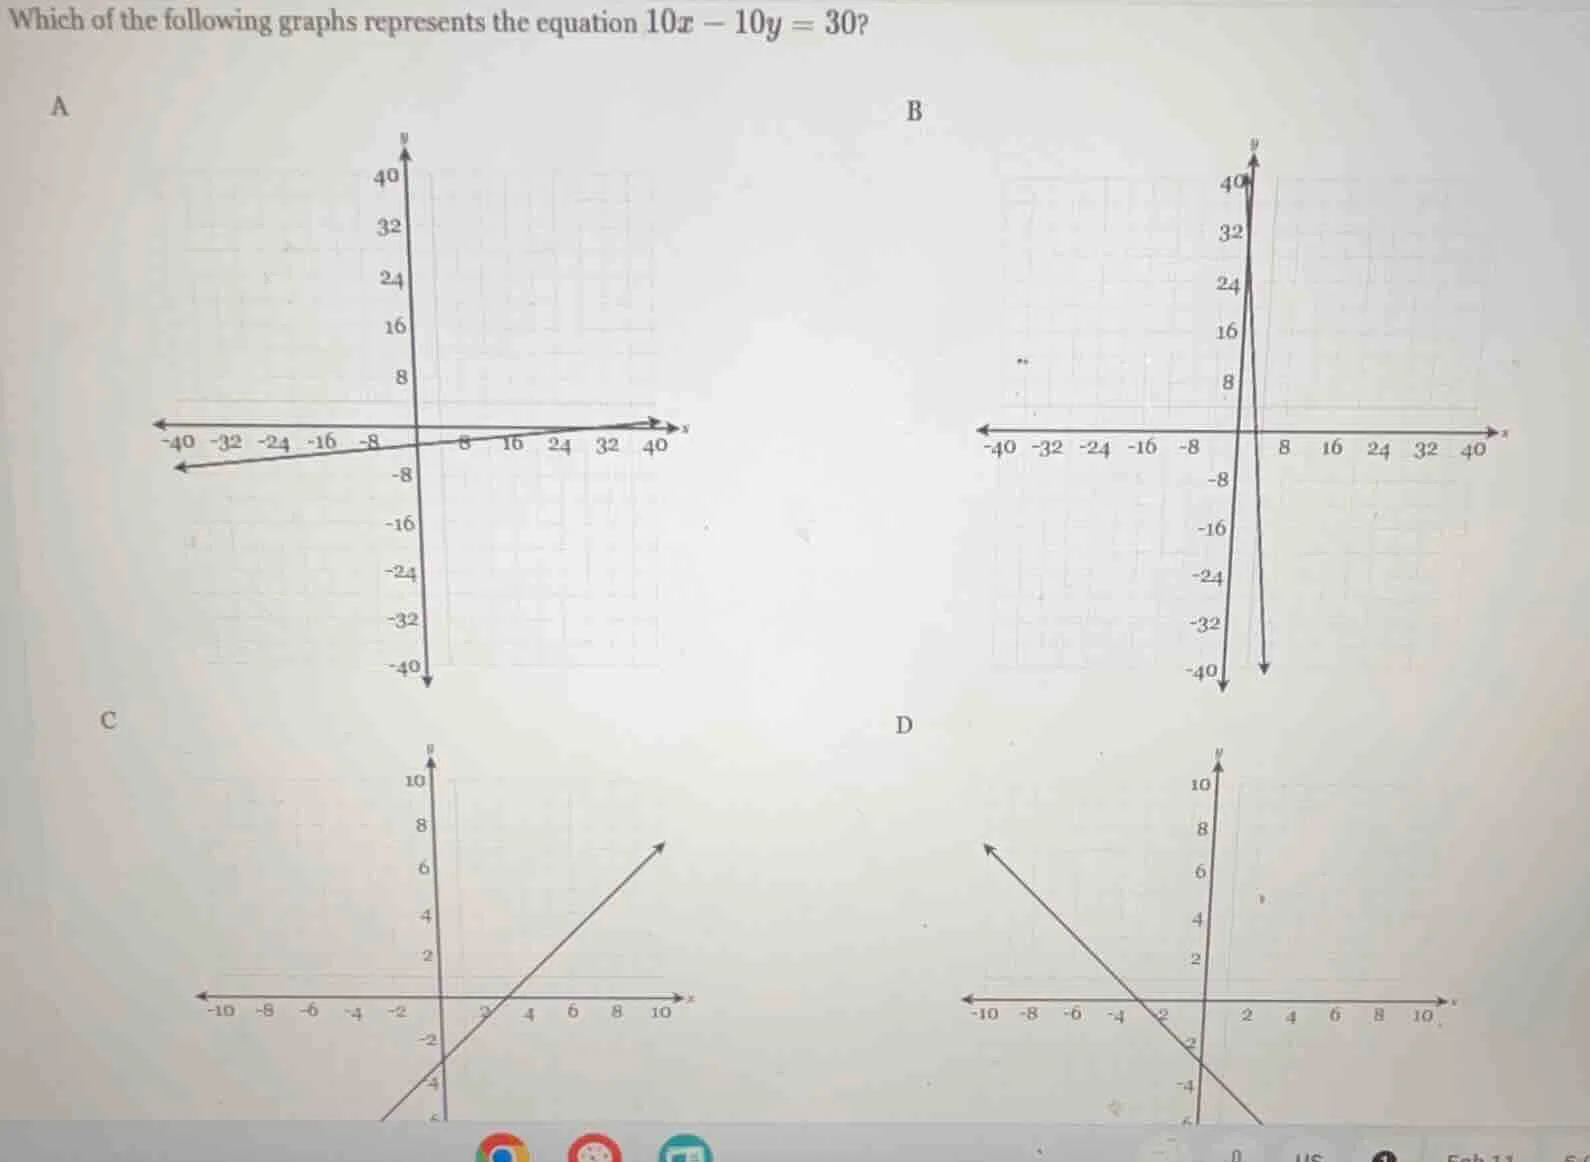
which of the following graphs represents the equation $10x - 10y = 30$?
a
b
c
d
Step1: Rewrite to slope-intercept form
Start with $10x - 10y = 30$. Divide all terms by 10:
$x - y = 3$
Rearrange to solve for $y$:
$y = x - 3$
Step2: Find x-intercept (y=0)
Set $y=0$, solve for $x$:
$0 = x - 3 \implies x=3$
So x-intercept is $(3, 0)$
Step3: Find y-intercept (x=0)
Set $x=0$, solve for $y$:
$y = 0 - 3 \implies y=-3$
So y-intercept is $(0, -3)$
Step4: Match to graph
The line has a positive slope ($m=1$) and intercepts $(3,0)$ and $(0,-3)$, which matches graph C.

Snap & solve any problem in the app
Get step-by-step solutions on Sovi AI
Photo-based solutions with guided steps
Explore more problems and detailed explanations
C. The line with x-intercept (3,0) and y-intercept (0,-3) with a positive slope