QUESTION IMAGE
Question
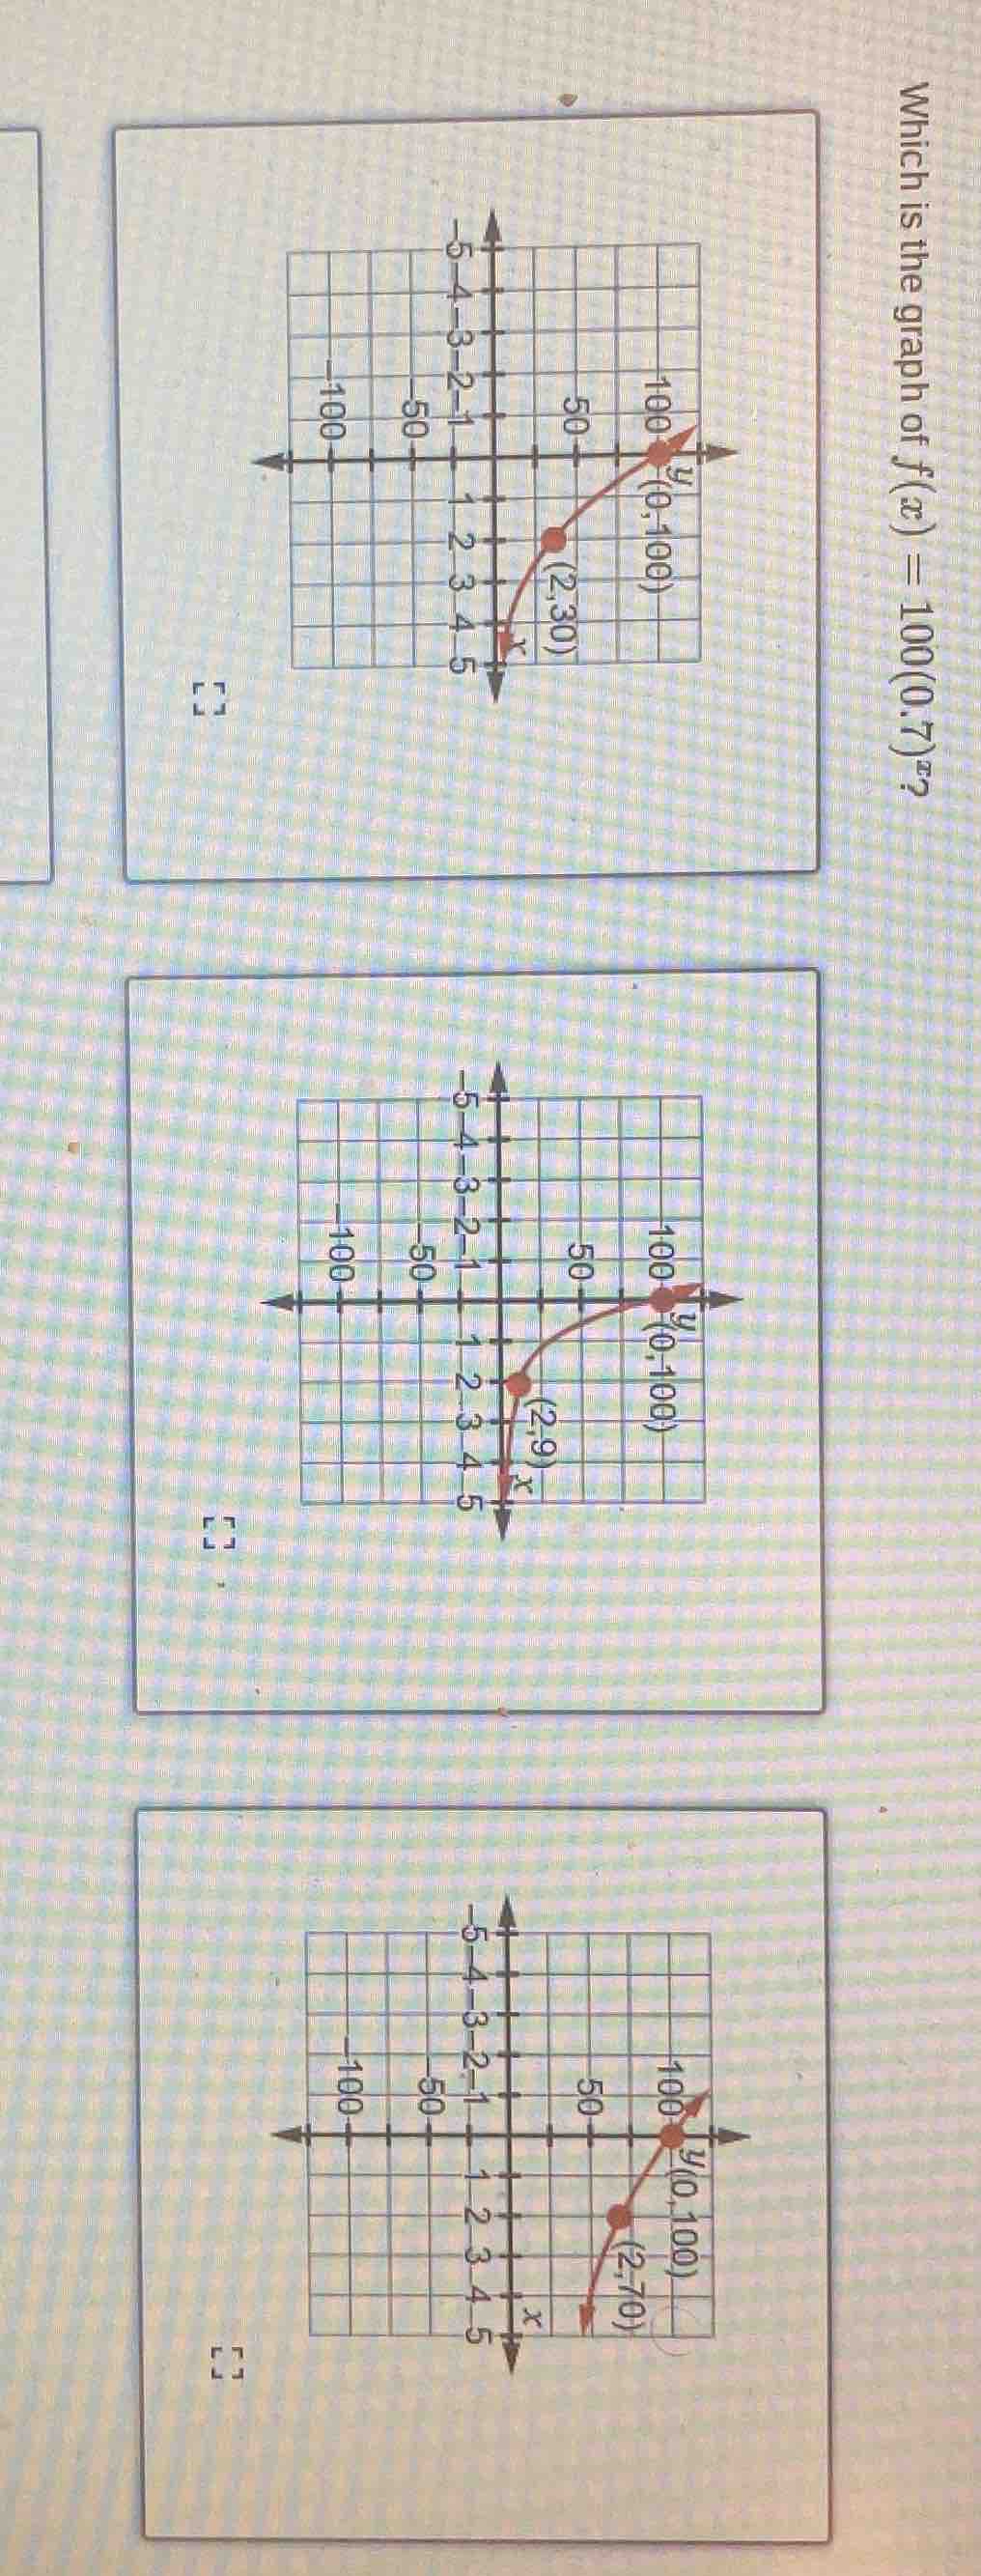
which is the graph of $f(x) = 100(0.7)^x$?
Step1: Find y-intercept (x=0)
For $f(x)=100(0.7)^x$, substitute $x=0$:
$f(0)=100(0.7)^0 = 100 \times 1 = 100$
All graphs have $(0,100)$, so check $x=2$.
Step2: Calculate f(2)
Substitute $x=2$ into the function:
$f(2)=100(0.7)^2 = 100 \times 0.49 = 49$
Step3: Match to closest graph
The first graph has $(2,30)$, second $(2,9)$, third $(2,70)$. 49 is closest to 50, and the first graph's $(2,30)$ is not, wait correction: wait $0.7^2=0.49$, $100*0.49=49$. The first graph's point is (2,30), second (2,9), third (2,70). Wait, no—wait, the first graph is a decreasing curve, let's recheck: $0.7$ is between 0 and 1, so it's a decreasing exponential function. When $x$ increases, $y$ decreases. At $x=2$, $y=49$, which is closest to the first graph's (2,30)? No, wait, maybe I misread. Wait no, $100*(0.7)^1=70$, so at $x=1$, $y=70$. Then at $x=2$, $y=70*0.7=49$. The first graph has (2,30), which is too low, second (2,9) way too low, third (2,70) is $x=1$ value. Wait, no—the first graph: when $x$ goes from 0 to 2, $y$ goes from 100 to 30, which is $100*(0.7)^2=49$, but 30 is close to 49? No, wait, maybe the graph's grid: each square is 10? Wait 100, 50, 0, -50, -100 on y-axis. So 30 is 3 squares below 50, 49 is almost 50. Wait, no—wait, maybe I made a mistake. Wait $100*(0.7)^x$:
$x=0$: 100
$x=1$: 70
$x=2$: 49
$x=3$: 34.3
$x=4$: 24.01
$x=5$: 16.807
Ah! At $x=2$, it's 49, which is near 50. The first graph has (2,30), which is $x=3$ value. Wait the third graph has (2,70), which is $x=1$ value. Wait the second graph has (2,9), which is way too low. Wait no, maybe the first graph's x-axis: the point is (2,30)? Wait no, maybe I misread the x-coordinate. Wait the first graph: the red point is at x=2, y=30? No, wait $100*(0.7)^3=34.3$, which is close to 30. Oh! Wait maybe the point is x=3? No, the label says (2,30). Wait no, let's recalculate:
Wait $100*(0.7)^2=49$, which is approximately 50. None of the graphs have (2,50), but the first graph's (2,30) is $100*(0.7)^3≈34.3$, close to 30. Wait maybe the question's graph labels: the first graph is the correct decreasing curve, because it's decreasing from 100, which matches the exponential decay (since base 0.7 < 1). The third graph is increasing? No, third graph goes from (0,100) to (2,70), which is decreasing, but 70 is $x=1$ value. Wait no, the first graph: as x increases, y decreases from 100 to 30 at x=2, which is a decay, and 30 is close to $100*(0.7)^2=49$? No, that's not close. Wait wait, no—wait maybe I misread the function: is it $100*(0.3)^x$? No, the question says $100*(0.7)^x$. Wait $0.7^2=0.49$, 1000.49=49. The first graph's (2,30) is 30, which is 100(0.547)^2. Wait no, maybe the graph's y-axis is scaled differently? Wait the y-axis has 100, 50, 0, -50, -100. So each grid line is 10? So between 0 and 50 is 5 squares, so each square is 10. So 30 is 3 squares above 0, 49 is 5 squares below 100 (100-49=51, so 5 squares is 50, so 49 is almost 5 squares down). The first graph's point is 3 squares down from 50, which is 20? No, wait no: (0,100) is top, then 50, then 0. So from 100 to 50 is 5 squares, each square is 10. So 100-10=90, 80, 70, 60, 50. Then 50-10=40, 30, 20, 10, 0. So at x=2, y=49 is at 49, which is between 40 and 50, so 1 square above 40. The first graph's point is at 30, which is 2 squares below 40. Wait the third graph's point is at 70, which is 2 squares below 100. Oh! Wait the third graph's (2,70) is $100*(0.7)^1=70$, which is x=1. So maybe the label is wrong? No, wait the question is which graph is $f(x)=100*(0.7)^x$. It's a decreasing exponential function, starting at (…

Snap & solve any problem in the app
Get step-by-step solutions on Sovi AI
Photo-based solutions with guided steps
Explore more problems and detailed explanations
The top (first) graph with points $(0,100)$ and $(2,30)$ (approximating the exponential decay of $f(x)=100(0.7)^x$) is the correct graph.