QUESTION IMAGE
Question
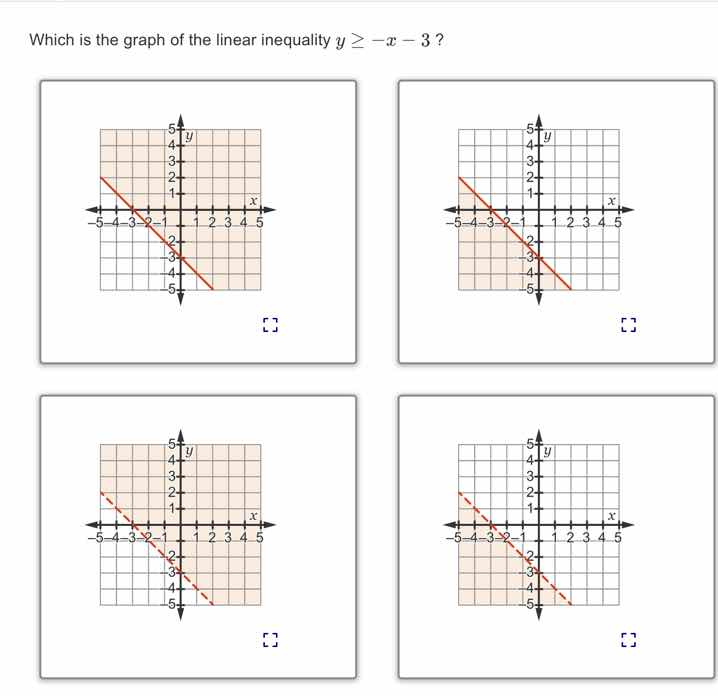
which is the graph of the linear inequality $y \geq -x - 3$ ?
Step1: Analyze the inequality type
The inequality is \( y \geq -x - 3 \). For linear inequalities, if the inequality is \( \geq \) or \( \leq \), the boundary line is solid; if it is \( > \) or \( < \), the boundary line is dashed. Here, since it's \( \geq \), the boundary line \( y=-x - 3 \) should be solid. This eliminates the options with dashed lines (the bottom two graphs).
Step2: Determine the region to shade
To find which side of the line to shade, we can test a point. Let's use the origin \((0,0)\). Substitute \( x = 0 \) and \( y = 0 \) into the inequality: \( 0\geq - 0-3\), which simplifies to \( 0\geq - 3 \). This is true. So we shade the region that includes the origin.
Now, let's analyze the two remaining graphs (top two). The line \( y=-x - 3 \) has a slope of \(- 1\) and a \( y \)-intercept of \(-3\). Let's check the shading:
- For the first top graph: The shaded region is above the line (since when we tested the origin, which is above the line \( y=-x - 3 \) (at \( x = 0 \), \( y=-3 \), and \( 0>-3 \)), and the line is solid.
- For the second top graph: The shaded region is below the line, which would not include the origin (since at \( x = 0 \), below the line \( y=-3 \) would be \( y < - 3 \), and \( 0\) is not less than \(-3\)), so this is incorrect.

Snap & solve any problem in the app
Get step-by-step solutions on Sovi AI
Photo-based solutions with guided steps
Explore more problems and detailed explanations
The graph with the solid line \( y = -x - 3 \) and the shaded region above the line (the first graph in the top row).