QUESTION IMAGE
Question
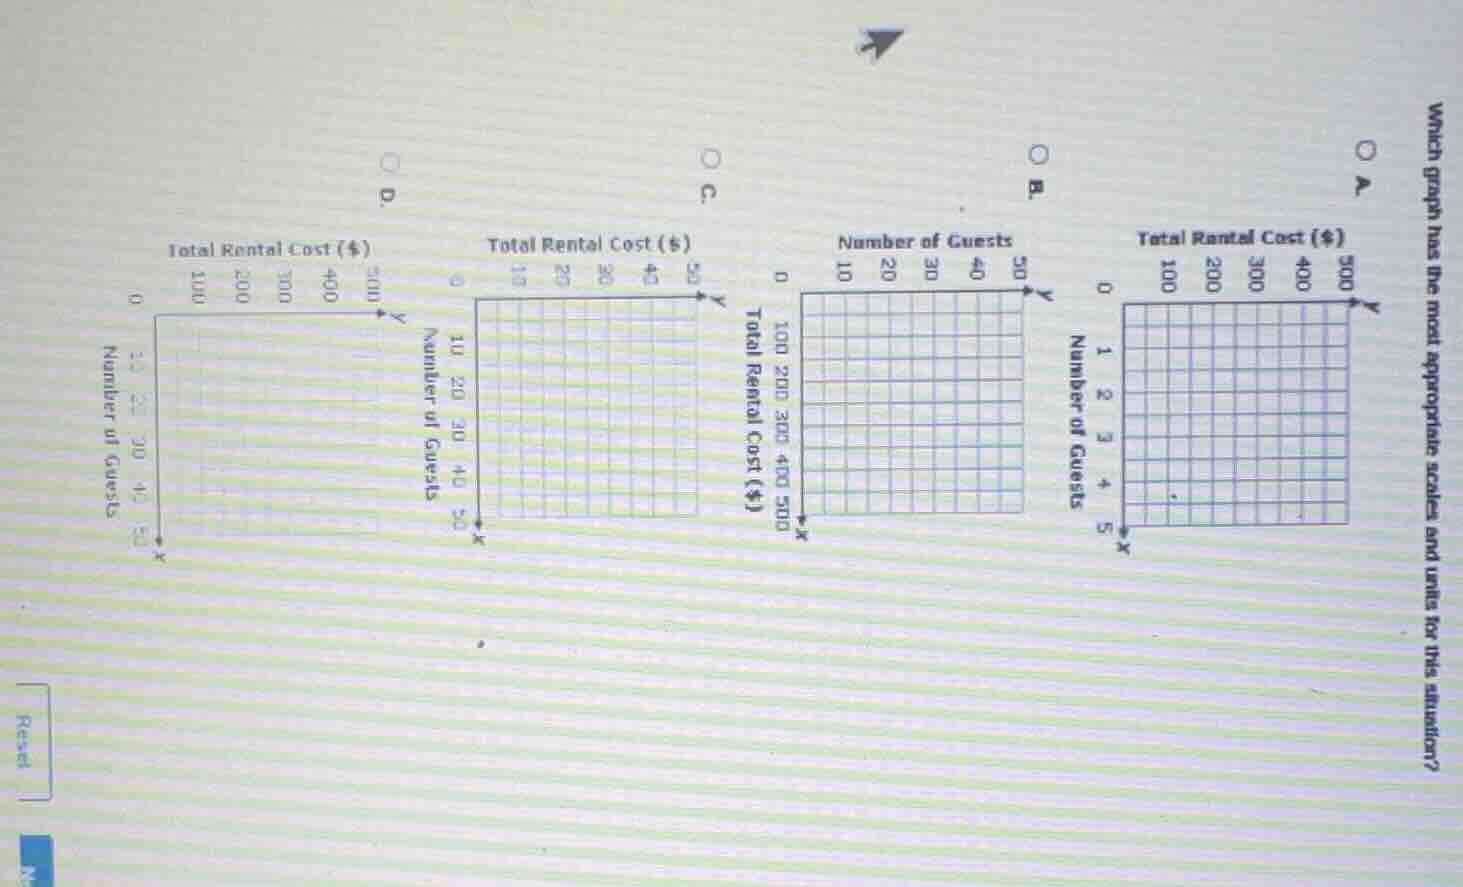
which graph has the most appropriate scales and units for this situation? a. graph with total rental cost ($) on y - axis (0 - 500) and number of guests on x - axis (0 - 5) b. graph with number of guests on y - axis (0 - 50) and total rental cost ($) on x - axis (0 - 500) c. graph with total rental cost ($) on y - axis (0 - 50) and number of guests on x - axis (0 - 50) d. graph with total rental cost ($) on y - axis (0 - 500) and number of guests on x - axis (0 - 50)
Step1: Analyze Axes and Scales
We need to check which graph has appropriate axes (x: Number of Guests, y: Total Rental Cost) and scales. Let's analyze each:
- Graph A: x-axis (Number of Guests) has max 5, y-axis (Cost) max 500. Scales too small if guests >5 or cost >500.
- Graph B: Axes reversed (x: Cost, y: Guests), which is incorrect for "Total Rental Cost vs Number of Guests".
- Graph C: x-axis (Guests) max 50, y-axis (Cost) max 50. Cost scale too small (likely cost >50).
- Graph D: x-axis (Guests) max 50, y-axis (Cost) max 500. Axes are correct (x: Guests, y: Cost) and scales are appropriate for a rental situation (guests up to 50, cost up to 500).

Snap & solve any problem in the app
Get step-by-step solutions on Sovi AI
Photo-based solutions with guided steps
Explore more problems and detailed explanations
D (The graph with x - axis as Number of Guests (0 - 50) and y - axis as Total Rental Cost ($0 - 500$))