QUESTION IMAGE
Question
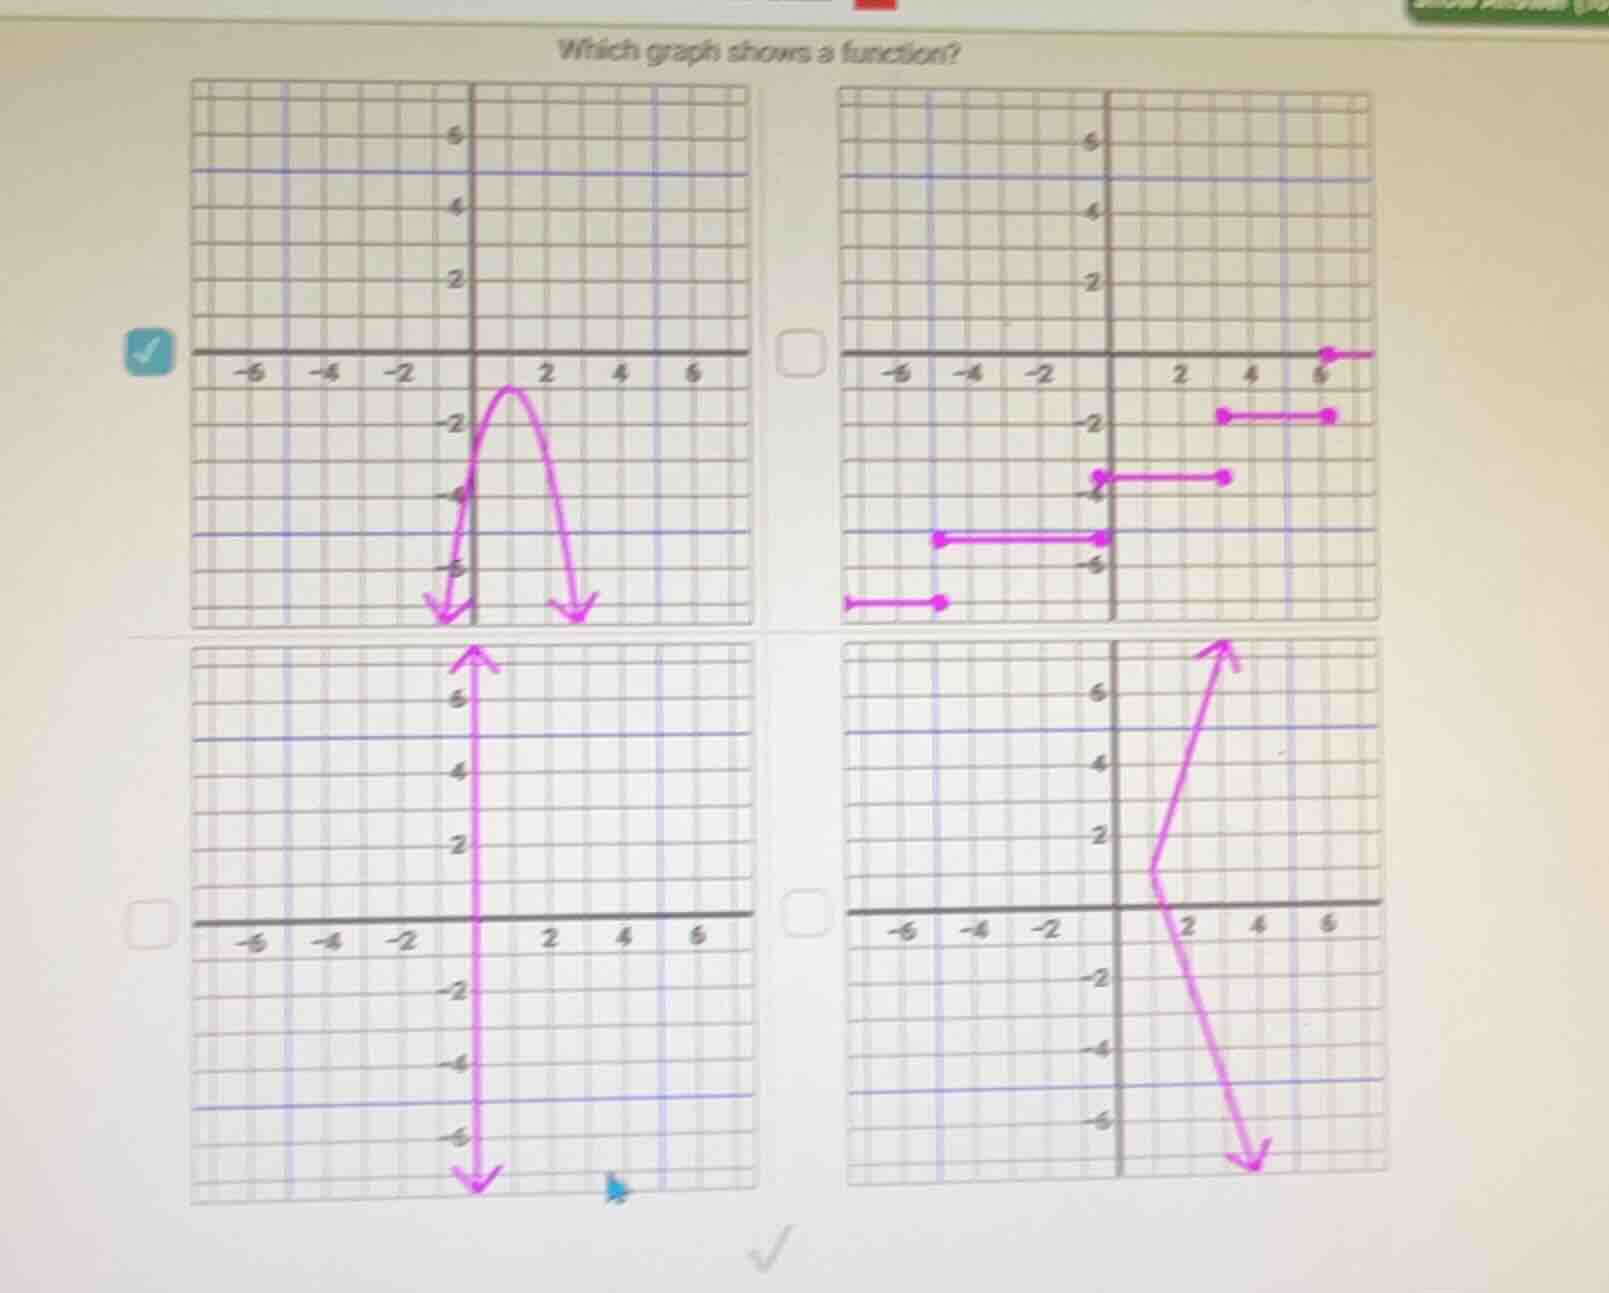
which graph shows a function?
Step1: Recall vertical line test rule
A graph represents a function if any vertical line drawn intersects the graph at most once.
Step2: Test top-left graph
Any vertical line intersects this parabola at most 1 point.
Step3: Test top-right graph
A vertical line (e.g., $x=5$) intersects 2 points, so not a function.
Step4: Test bottom-left graph
A vertical line (the y-axis, $x=0$) intersects infinitely many points, so not a function.
Step5: Test bottom-right graph
A vertical line (e.g., $x=2$) intersects 2 points, so not a function.

Snap & solve any problem in the app
Get step-by-step solutions on Sovi AI
Photo-based solutions with guided steps
Explore more problems and detailed explanations
The top-left graph (the downward-opening parabola) is a function.