QUESTION IMAGE
Question
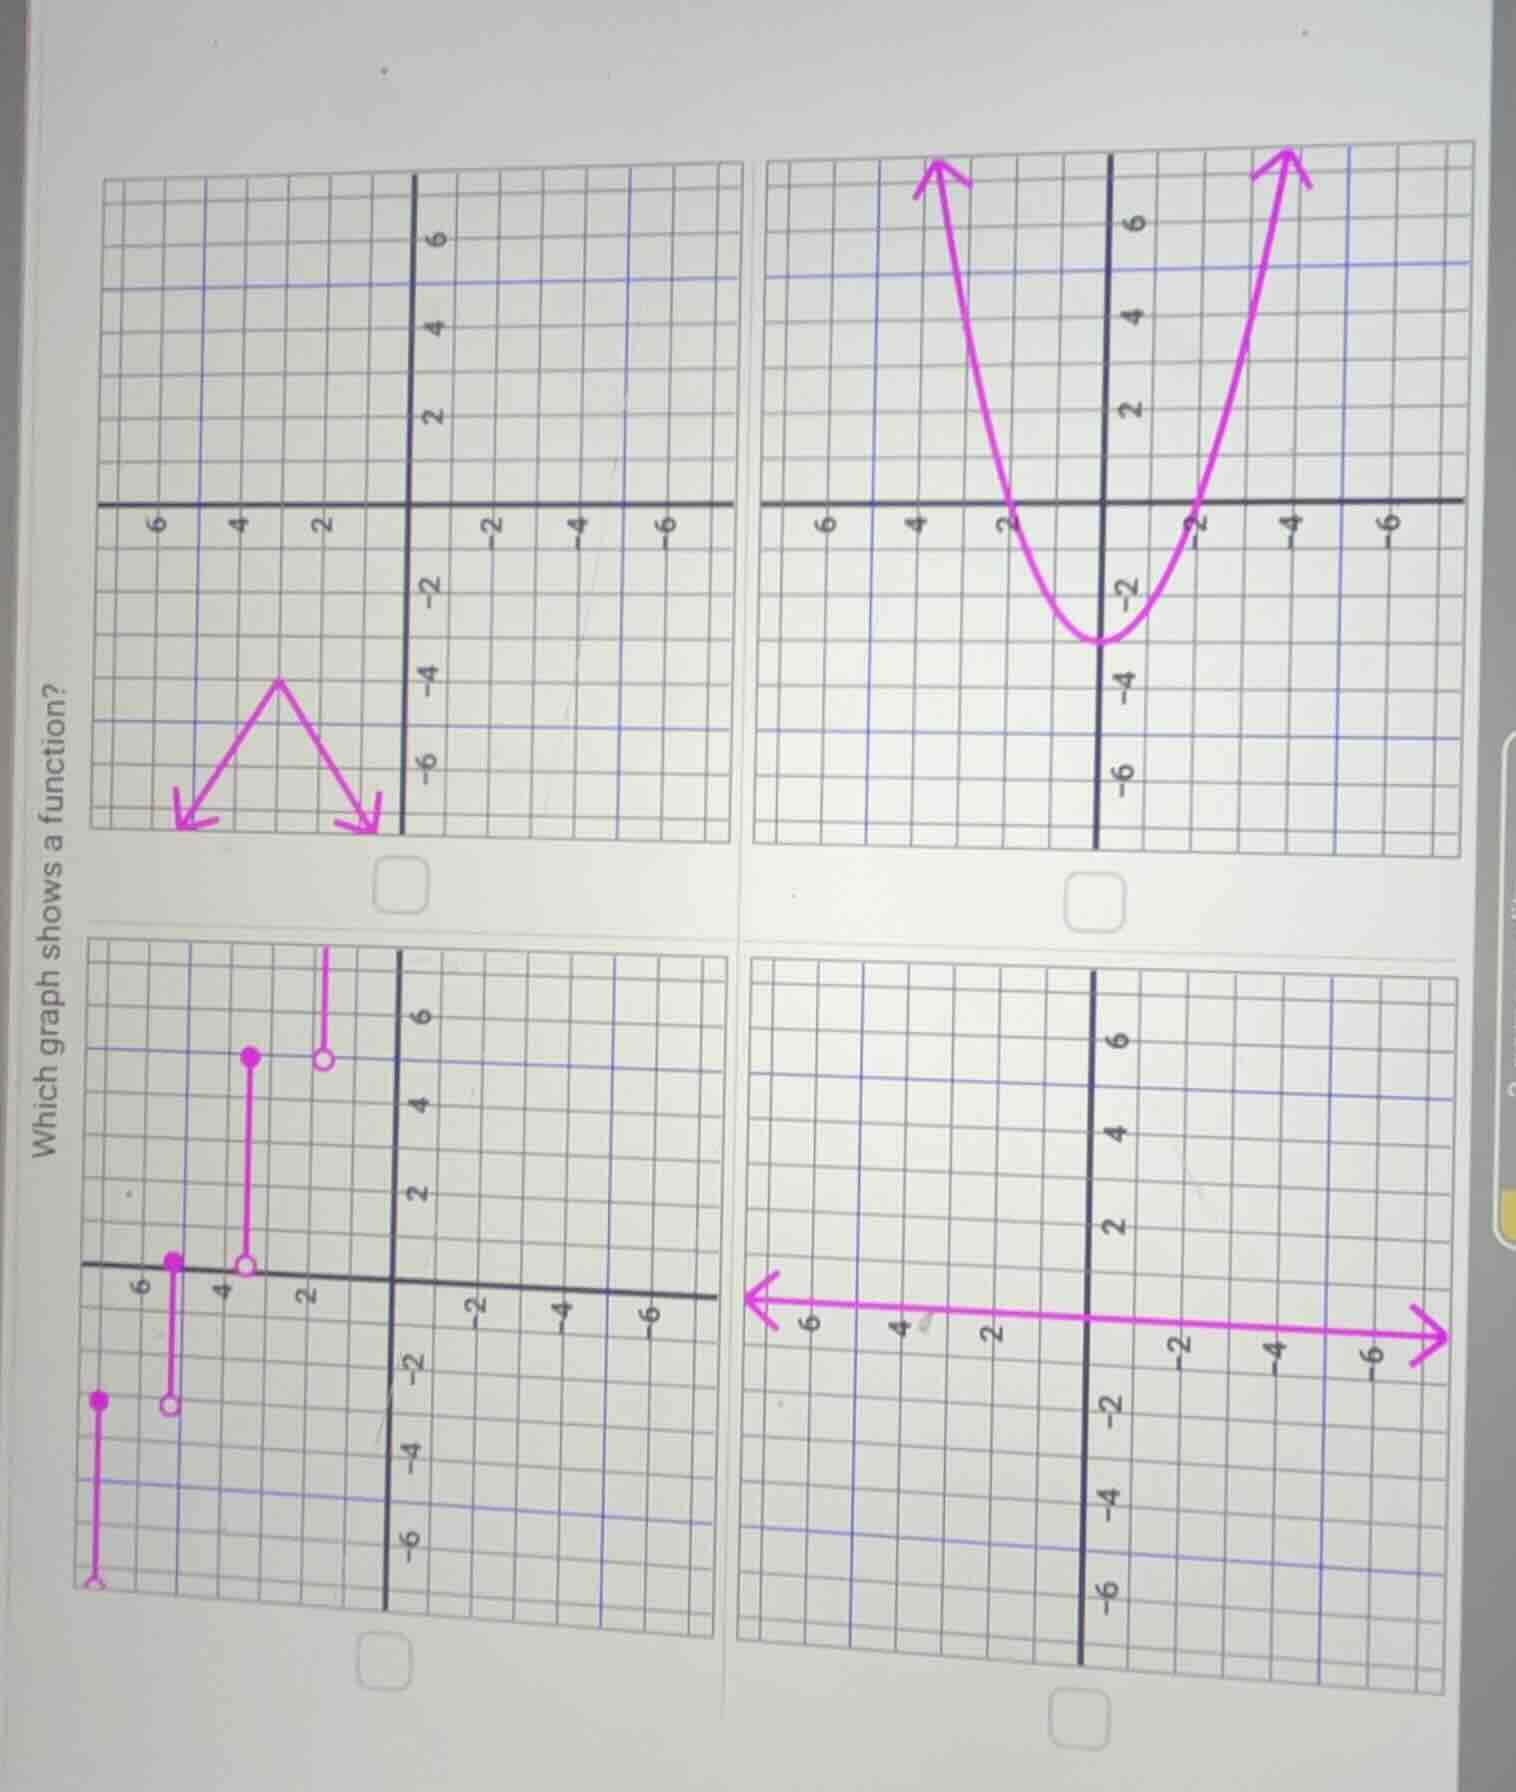
which graph shows a function?
Brief Explanations
A graph represents a function if it passes the Vertical Line Test: any vertical line drawn on the graph intersects it at most once.
- Top-left graph: A vertical line would intersect the graph twice, so it is not a function.
- Top-right graph: Every vertical line intersects the graph at most once, so it is a function.
- Bottom-left graph: A vertical line would intersect the graph twice (at the open/closed points), so it is not a function.
- Bottom-right graph: A vertical line would intersect the graph infinitely many times, so it is not a function.

Snap & solve any problem in the app
Get step-by-step solutions on Sovi AI
Photo-based solutions with guided steps
Explore more problems and detailed explanations
The top-right parabola graph (opening upwards with vertex below the x-axis) shows a function.